Figure 1.
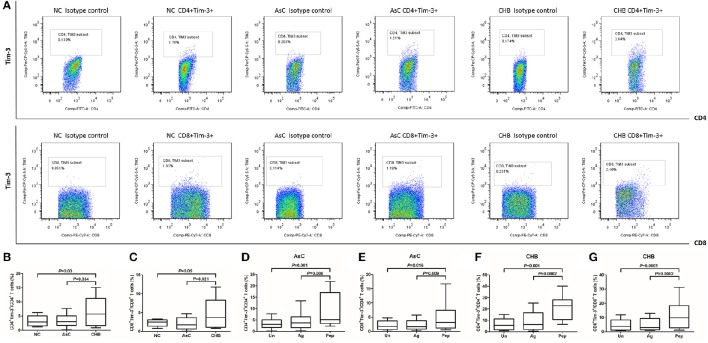
Tim-3 expression on CD4+ and CD8+ T cells in response to HBV-encoding antigens and HBV peptide pools. PBMCs from all enrolled subjects (including 40 of NCs, 36 of AsC, and 40 of CHB) were stained and tested. (A) Representative flow plots of Tim-3+ cells within CD4+ and CD8+ T cells in normal control (NC), asymptomatic HBV carrier (AsC), and chronic hepatitis B (CHB). PerCP-Cy5.5 Isotype control was used in each analysis for the separation of Tim-3-positive and -negative population. Comparison of frequencies for CD4+Tim-3+ (B) and CD8+Tim-3+ cells (C) in NCs, AsC, and CHB. Thus, the frequencies of Tim-3 expression on unstimulated T cells were used as controls for further studies. Comparison of frequencies for CD4+Tim-3+ (D) and CD8+Tim-3+ cells (E) in response to HBV-encoding antigens and HBV peptide pools stimulations for 4 days in AsC. Comparison of frequencies for CD4+Tim-3+ (F) and CD8+Tim-3+ cells (G) in response to HBV-encoding antigens and HBV peptide pools stimulations for 4 days in CHB. Data were presented as box-and-whisker plot. The box presented as median and quartile, and the whisker plot presented as 2.5–97.5% percentile. Dunn's multiple comparison test were used for comparison between groups.

