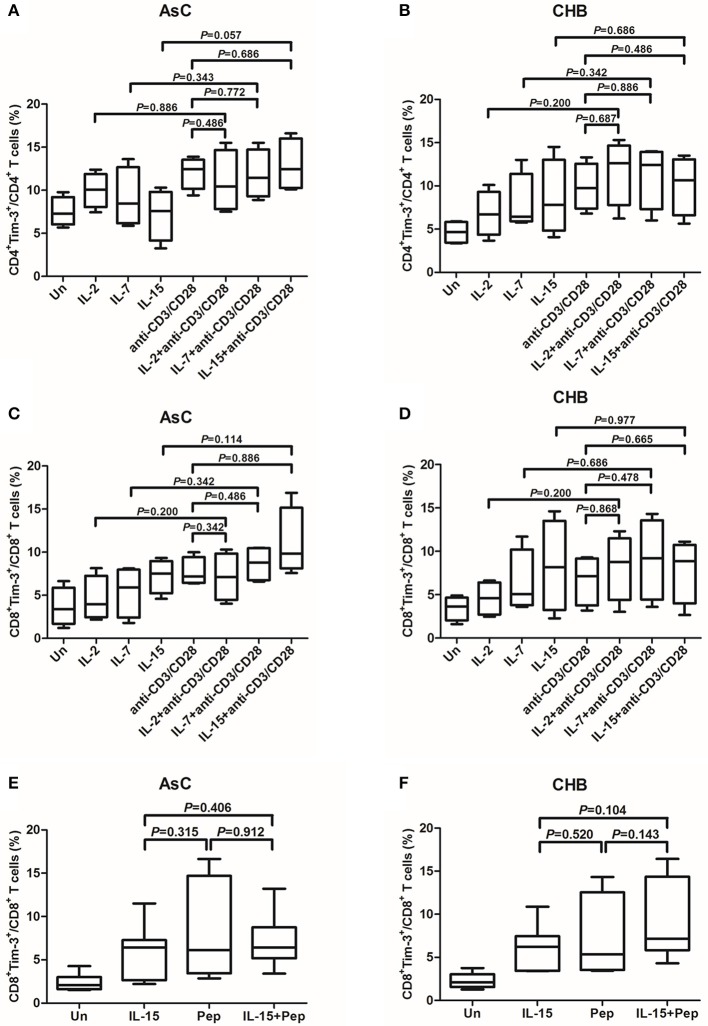
Figure 3.
Induction of Tim-3 expression on T cells within PBMCs in response to common γ-chain (γc) cytokine plus antigens costimulation. PBMCs were selected from 10 of AsC and 10 of CHB, which were used in the experiments of Figure 1 but did not overlap with the patients from Figure 2. Total PBMCs were treated with IL-2 (25 ng/mL), IL-7 (25 ng/mL), IL-15 (25 ng/mL) plus anti-CD3/CD28 (1 μg/mL) or HBV peptide pools (10 μg/mL). Tim-3 expressions were assessed on CD4+ and CD8+ T cells. (A) Comparison of frequencies for CD4+Tim-3+ cells in response to stimulation of γc cytokines and costimulation of γc cytokines plus anti-CD3/CD28 in AsC. (B) Comparison of frequencies for CD4+Tim-3+ cells in response to stimulation of γc cytokines and costimulation of γc cytokines plus anti-CD3/CD28 in CHB. (C) Comparison of frequencies for CD8+Tim-3+ cells in response to stimulation of γc cytokines and costimulation of γc cytokines plus anti-CD3/CD28 in AsC. (D) Comparison of frequencies for CD8+Tim-3+ cells in response to stimulation of γc cytokines and costimulation of γc cytokines plus anti-CD3/CD28 in CHB. (E) Comparison of frequencies for CD8+Tim-3+ cells in response to IL-15 stimulation and costimulation of IL-15 plus HBV peptide pools in AsC. (F) Comparison of frequencies for CD8+Tim-3+ cells in response to IL-15 stimulation and costimulation of IL-15 plus HBV peptide pools in CHB. Data were presented as box-and-whisker plot. The box presented as median and quartile, and the whisker plot presented as 2.5–97.5% percentile. Dunn's multiple comparison test were used for comparison between groups.

