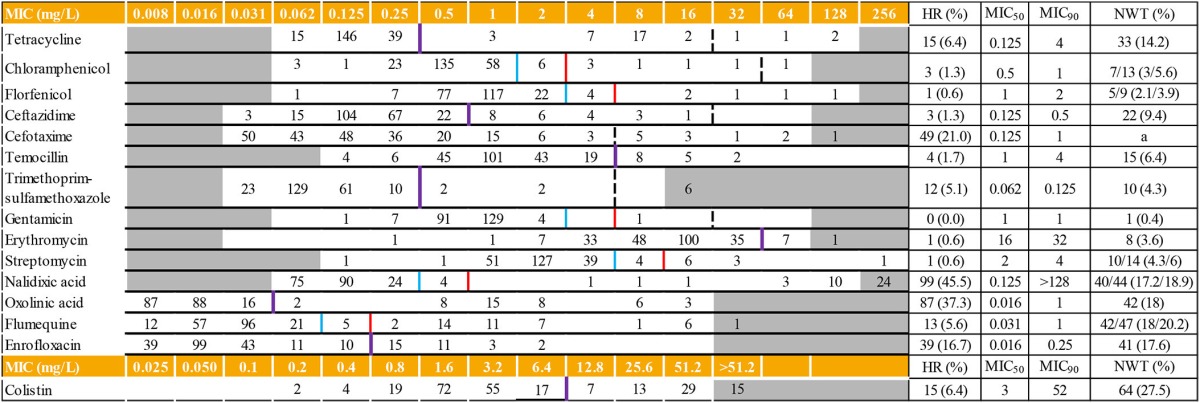
Table 1.
Distribution of MICs (mg/L) in 233 isolates of Aeromonas spp. and interpretive criteria.

White fields represent the range of dilutions tested. MIC values equal to or lower than the lowest concentration tested are presented as the lowest concentration. MIC values greater than the highest concentration tested are presented as one dilution step above the test range.
Red, blue and dotted vertical lines indicate COWT calculated applying Kronvall method, COWT calculated with Turnidge method (in case of agreement purple lines are therefore represented) and clinical breakpoint proposed by CLSI, respectively for Aeromonas spp. No COWT was calculated for cefotaxime as the mode was out of the range.
HR (%): number (percentage) of isolates for which the MIC value was not in the range test, ie value below and above the range. So in several cases, number of isolates in the raw of the lower concentration included isolates with MIC below the range.
NWT (%): number (percentage) of isolates of non-wild type using COWTvalues resulting from Kronvall/Turnidge method respectively.
a: no COWT was calculated.
