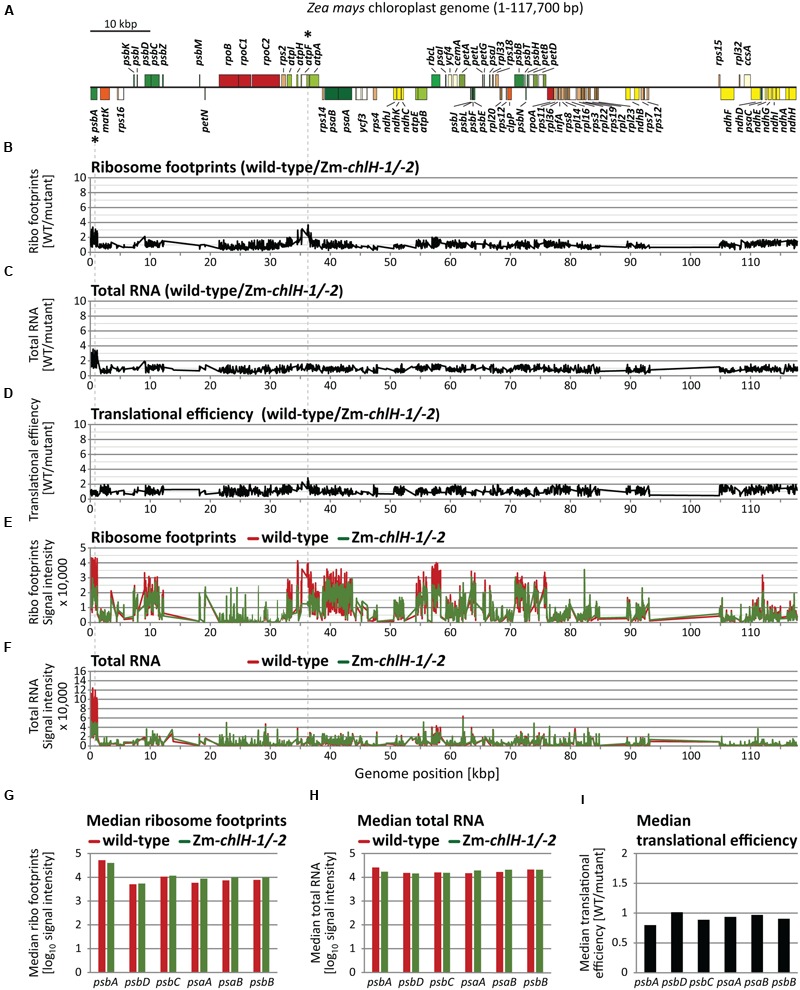
FIGURE 2.

Microarray-based plastome-wide analysis of ribosome footprint and transcript abundances in the wild-type and the Zm-chlH-1/-2 mutant. Plots are based on data that are provided in Supplementary Dataset S1. Genome positions refer to the reference maize chloroplast genome (Maier et al., 1995). (A) Gene map indicating protein-coding genes of the maize chloroplast genome created with OGDraw (Lohse et al., 2013). The circular map of the chloroplast genome was linearized and shows only the first of the two large inverted repeat regions. Asterisks mark genes with defects in gene expression based on the microarray data in B-F (wild-type to mutant signal ratio > 3). Dashed lines connect these genes on the map with peaks in the plots below. (B) Normalized ratios of ribosome footprint signals (Ribo footprints) in wild-type versus mutant are plotted as a function of genome position. Peaks designate regions with more ribosome footprints in the wild-type compared to the mutant. (C) Normalized ratios of total RNA signals in wild-type versus mutant are plotted as a function of genome position. Peaks represent regions with higher RNA accumulation in the wild-type compared to the mutant. (D) Translational efficiencies were calculated as the ratios of ribosome footprint ratios (shown in B) to total RNA ratios (shown in C). (E) Normalized ribosome footprint signal intensities obtained from wild-type (red) and mutant (green). (F) Normalized total RNA signal intensities obtained from wild-type (red) and mutant (green). (G) Median ribosome footprint signals for chlorophyll apoprotein-coding ORFs (signals plotted in log10-scale). (H) Median total RNA signals for chlorophyll apoprotein-coding ORFs (signals plotted in log10-scale). (I) Median translational efficiency values for chlorophyll apoprotein-coding ORFs.
