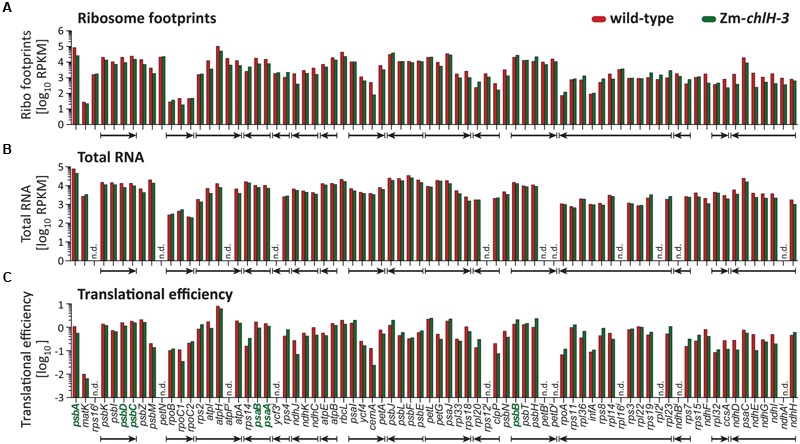
FIGURE 3.

Summary of deep-sequencing analysis of plastid ribosome footprint and transcript abundances in wild-type and Zm-chlH-3 mutant leaf tissue. Genes encoding chlorophyll-binding proteins are shown in bold green font. The data are displayed as the number of reads per ORF after normalizing to ORF length (kilobase) per million reads mapping to nuclear genome coding sequences (RPKM; values are shown in Supplementary Dataset S2). Translational efficiencies are calculated as the ratios of ribosome footprint to transcript reads. Co-transcribed genes are marked with arrows according to the direction of transcription. (A–C) Ribosome footprint abundance, transcript levels, and the derived translational efficiencies are displayed according to native gene order on the maize chloroplast genome. RNA levels and translational efficiencies of petN and intron containing ORFs (marked with i) were not determined (n.d.) due to technical limitations that preclude accurate quantification of the mRNAs. The ribosome footprint values provided for intron-containing ORFs come only from the last exon or, in the case of rps12, from exon 2.
