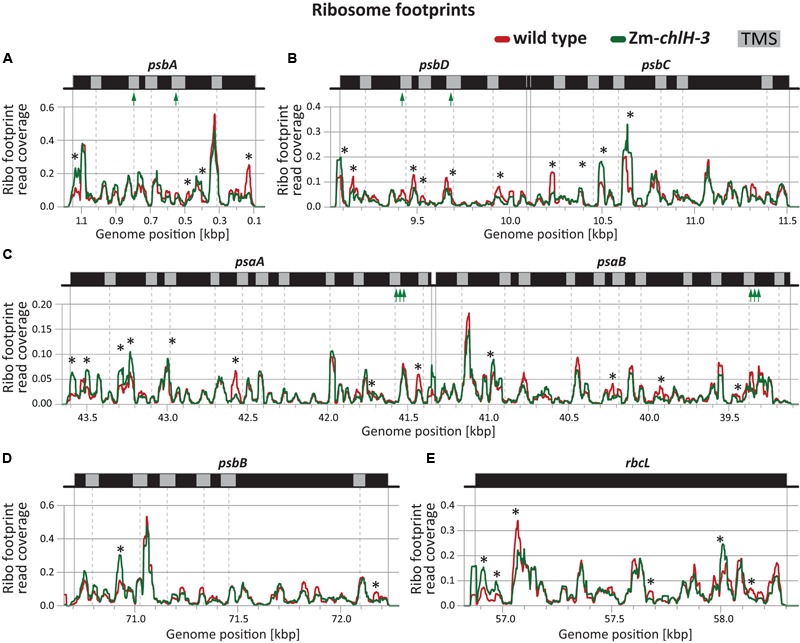
FIGURE 4.

Ribosome footprint distributions along mRNAs encoding chlorophyll apoproteins based on deep-sequencing data. Data from wild-type and Zm-chlH-3 mutant plants are plotted in red and green, respectively. Annotations are as in Figure 2. Total read counts within the genomic region shown in each panel of each genotype were standardized to a value of 100 (based on coverage normalized to million reads mapping to nuclear coding sequences). The positions of annotated transmembrane segments (TMS) and chlorophyll-binding sites are shown by gray rectangles and green arrows, respectively. TMS positions are based on information provided previously (Zoschke and Barkan, 2015). Asterisks denote minor differences in ribosome coverage between wild-type and Zm-chlH-3 (ratio > 2 or < 0.5). (A–D) Normalized ribosome footprint distributions along mRNAs encoding chlorophyll binding apoproteins. (E) Normalized ribosome footprint distribution along the rbcL mRNA is shown as a control. rbcL encodes the large subunit of Rubisco, which does not bind chlorophyll.
