FIGURE 5.

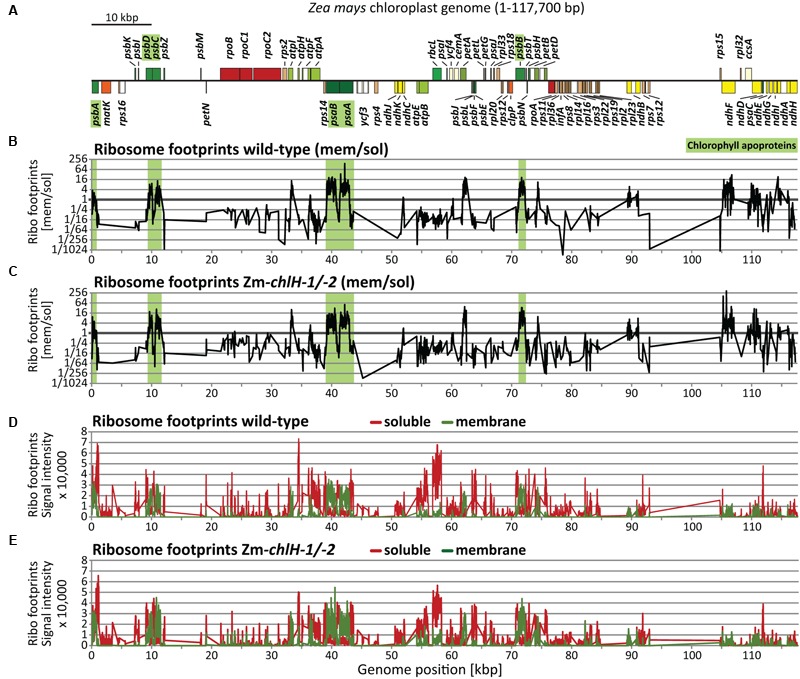
Plastome-wide analysis of co-translational membrane engagement in wild-type and Zm-chlH-1/-2 mutant plants by microarray-based ribosome profiling. (A) Map of the maize chloroplast genome showing only protein-coding genes. Genes highlighted in green encode chlorophyll-binding apoproteins. Plots are based on data that are provided in Supplementary Dataset S3. Plots and data for wild-type-derived footprints are identical to those we presented previously (Zoschke and Barkan, 2015). (B,C) Normalized ratios of ribosome footprint signals from membrane and soluble fractions in wild-type (B) and mutant (C) leaf tissue, plotted according to genome position. Note that ribosomes that are tethered to membranes solely by mRNA are recovered in the soluble fraction (see Supplementary Figure S3). Green shaded regions mark ORFs encoding chlorophyll-binding apoproteins. (D,E) Normalized signals for soluble (red) and membrane-bound (green) ribosome footprints in wild-type (D) and mutant (E) leaf tissue.
