Abstract
Genomics-assisted breeding methods have been rapidly developed with novel technologies such as next-generation sequencing, genomic selection and genome-wide association study. However, phenotyping is still time consuming and is a serious bottleneck in genomics-assisted breeding. In this study, we established a high-throughput phenotyping system for sorghum plant height and its response to nitrogen availability; this system relies on the use of unmanned aerial vehicle (UAV) remote sensing with either an RGB or near-infrared, green and blue (NIR-GB) camera. We evaluated the potential of remote sensing to provide phenotype training data in a genomic prediction model. UAV remote sensing with the NIR-GB camera and the 50th percentile of digital surface model, which is an indicator of height, performed well. The correlation coefficient between plant height measured by UAV remote sensing (PHUAV) and plant height measured with a ruler (PHR) was 0.523. Because PHUAV was overestimated (probably because of the presence of taller plants on adjacent plots), the correlation coefficient between PHUAV and PHR was increased to 0.678 by using one of the two replications (that with the lower PHUAV value). Genomic prediction modeling performed well under the low-fertilization condition, probably because PHUAV overestimation was smaller under this condition due to a lower plant height. The predicted values of PHUAV and PHR were highly correlated with each other (r = 0.842). This result suggests that the genomic prediction models generated with PHUAV were almost identical and that the performance of UAV remote sensing was similar to that of traditional measurements in genomic prediction modeling. UAV remote sensing has a high potential to increase the throughput of phenotyping and decrease its cost. UAV remote sensing will be an important and indispensable tool for high-throughput genomics-assisted plant breeding.
Keywords: genomic prediction, high-throughput phenotyping, near-infrared (NIR), sorghum plant height, UAV remote sensing
Introduction
Improving the throughput of phenotyping in the field is a big challenge in plant genetics, physiology, and breeding. The emergence of the next-generation sequencing technologies enables us to obtain genome-wide DNA polymorphism data for a large number of samples easily and rapidly (Mardis, 2007; Davey et al., 2011). Statistical methods, such as genome-wide association study (GWAS; Brachi et al., 2011; Korte and Farlow, 2013; Huang and Han, 2014) and genomic selection (GS; Meuwissen et al., 2001; Jannink et al., 2010) allow us to associate DNA polymorphism data, which is extremely high-dimensional, to phenotypic variations in agronomic traits. Boosted by these technological developments, the efficiency of plant breeding is expected to improve rapidly (Huang and Han, 2014). However, phenotyping is still time consuming and labor intensive, and may be more costly than genotyping. Thus, phenotyping has become a serious bottleneck in the acceleration of plant breeding (Furbank and Tester, 2011). Field experiments at multiple plant breeding stations over a large geographic area are indispensable to evaluate the adaptability of new candidate genotypes and to examine the pattern of genotype-environment interaction (Chapman et al., 2014). At each breeding station, a large number of genotypes are tested in the field. Most of the measurements conducted in the field are destructive and labor- and time-intensive, and thus cannot be repeated frequently in the course of plant growth. Because phenotypic data is necessary for genomics-assisted breeding, it is the first priority to develop a high-throughput phenotyping method.
Remote sensing using a low-altitude unmanned aerial vehicle (UAV), such as radio-controlled multicopter, can solve the problem described above. Besides low-altitude UAVs, measurements using satellites (Inoue, 1997) and ground-based vehicles (Lee and Searcy, 1999) have been applied for remote sensing of growth conditions of crop plants (Sugiura et al., 2005). However, satellites have low resolution, poor sensitivity under cloudy conditions, and slow data transmission (Sugiura et al., 2005; Zhang and Kovacs, 2012), and ground-based vehicles cannot enter fields with tall crops or muddy soil (Sugiura et al., 2005; Chapman et al., 2014). Low-altitude UAVs have no such disadvantages and can be used without expert skills (Merz and Chapman, 2011). Most low-altitude UAVs have an autopilot function to fly automatically along a route designed by mission planning software (Berni et al., 2009; Chapman et al., 2014; Zarco-Tejada et al., 2014; Díaz-Varela et al., 2015). Another widespread remote sensing technology is light detection and ranging (LiDAR). However, this technology has some shortcomings, e.g., high cost of data acquisition and processing (Díaz-Varela et al., 2015). The emergence of computer-vision technologies, such as the structure-from-motion and multi-view-stereo algorithms, enables reconstruction of accurate 3D-models from a series of images with a considerable overlap between adjacent images. These technologies are attractive alternatives to LiDAR, due to their high performance, flexibility, and relatively low cost (Díaz-Varela et al., 2015). For remote sensing of plants, near-infrared (NIR) cameras have been used in many studies (Lee and Searcy, 1999; Sugiura et al., 2005; Berger et al., 2010; Cabrera-Bosquet et al., 2011; van Maarschalkerweerd et al., 2013; Colomina and Molina, 2014; Díaz-Varela et al., 2015; Torres-Sánchez et al., 2015), because plant leaves (or chlorophylls) strongly reflect NIR light (Knipling, 1970; Tucker, 1979; Fahlgren et al., 2015) and some indices based on NIR reflectance rate, such as normalized difference vegetation index (NDVI; Rouse et al., 1974), are useful for identifying plants and assessing their growing conditions via remote sensing. Some studies have indicated that NIR sensors have advantages over standard RGB sensors in plant monitoring (Nijland et al., 2014; Zhang et al., 2016). Nevertheless, NIR cameras are less common, and often more expensive than RGB cameras (or extra cost is needed to modify RGB cameras into NIR cameras). Because remote sensing is a promising tool for phenotyping, we compared the advantages of RGB and NIR cameras in phenotyping and genomic prediction modeling.
Genomic selection is a novel breeding method that allows selection of complex traits with genome-wide markers. Because the selection is performed on the basis of the genetic potential predicted from these markers, GS requires building an accurate prediction model based on a dataset of individuals or lines that have been genotyped and phenotyped (Meuwissen et al., 2001; Jannink et al., 2010). A large dataset is needed to build an accurate prediction model. As mentioned above, however, phenotyping is time consuming and labor intensive, and is a serious bottleneck in building an accurate model. If UAV remote sensing can streamline the collection of phenotypic data, it will greatly enhance the potential of GS.
Using image-processing software for photogrammetry, we can obtain ortho-mosaic and a digital surface model (DSM) from UAV images (Gini et al., 2013). Ortho-mosaic is a distortion-corrected image. DSM provides information on the altitude. In plant science, DSM information has been applied to estimate biomass and plant height of barley (Bendig et al., 2014), and plant height, volume, and canopy size of olive trees (Zarco-Tejada et al., 2014; Díaz-Varela et al., 2015; Torres-Sánchez et al., 2015). Currently, we are using genomics-assisted breeding to develop a sorghum [Sorghum bicolor (L.) Moench] variety that can be used for high bioethanol production for biofuel. Plant height is one of the most important traits affecting bioethanol yield. Because some sorghum accessions may be taller than 4 m, they are usually cut for measurements, which are labor intensive, whereas GS requires phenotypic data and marker genotype data for a large number of accessions.
The objectives of this study are the validation of the usefulness of UAV remote sensing for measurement of sorghum plant height and for genomic prediction modeling. First, we confirmed the accuracy of plant height estimates from UAV images under the conditions of small plot size. Next, we examined the accuracy of genomic prediction of plant height trained by UAV remote sensing data and data manually measured with a ruler. To evaluate the robustness of this method to plant height variation related to environmental differences such as nutrition level, sorghum plants were grown at two levels of nitrogen availability. We also compared the measurement and prediction accuracy of different cameras and different procedures of remote sensing data analysis.
Materials and Methods
Field Experiment
In this study, we used 172 accessions from sorghum germplasm collections (Supplementary Table 1). Of these, 78 accessions were from the world core collection of NIAS (National Institute of Agrobiological Science, Ibaraki, Japan; integrated into the National Agriculture and Food Research Organization from April 1, 2016), 91 were from the sorghum mini core collection of ICRISAT (International Crops Research Institute for the Semi-Arid Tropics, Patancheru, India) and 3 were original cultivars developed by EARTHNOTE Co., Ltd. (Okinawa, Japan). Seeds were sown on 200-cell plug trays on May 8, 2014. Seedlings were transplanted to a field of the Institute for Sustainable Agro-ecosystem Services, the University of Tokyo (Tokyo, Japan; 35°44′09.1″N, 139°32′23.7″E, 60 m above the sea level) on June 9, 2014. An outline of the field design is shown in Figure 1. To investigate the effect of fertilization on plant growth, we used normal (N-P-K: 1.2-1.8-1.6 kg/a) and low (N-P-K: 0.6-1.8-1.6 kg/a) fertilization in two replications per treatment per accession (172 × 4 = 688 plots in total). Five plants were grown in each plot (inter-plant spacing, 0.3 m; inter-row spacing, 0.72 m). On October 2 and 3, two plants per plot were harvested and their height was measured with a ruler. In total, 688 × 2 = 1,376 plants were measured.
FIGURE 1.
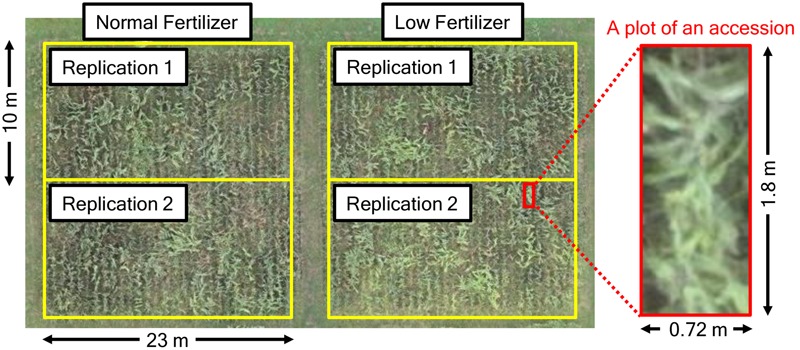
Field design in this study.
Remote Sensing Experiment
The radio-controlled quadcopter USM-S1 (Air4D Co., Ltd., Tokyo, Japan; Figure 2A), was used as a UAV for remote sensing. Two digital cameras, Canon PowerShot ELPH 110HS (Canon Inc., Tokyo, Japan), were installed on the UAV (resolution, ca. 16.1 million pixels; sensor size, 6.2 mm × 4.7 mm; focal length, 4.3–21.5 mm). One was a normal RGB camera, and the other one was modified to capture NIR, green and blue (NIR-GB). The NIR-GB camera was purchased at MaxMax Inc. (Carlstadt, NJ, USA). The focal length was set at 4.3 mm. The focus was adjusted by the camera auto-focus function. On the ground at each corner of the field, we installed a white acrylic disk (27 cm in diameter) as a ground control point (GCP) (Figure 2C). The positions of GCPs in the World Geodetic System were measured by using GPS (Geo7X, Trimble Inc., Sunnyvale, CA, USA) and used in image processing.
FIGURE 2.
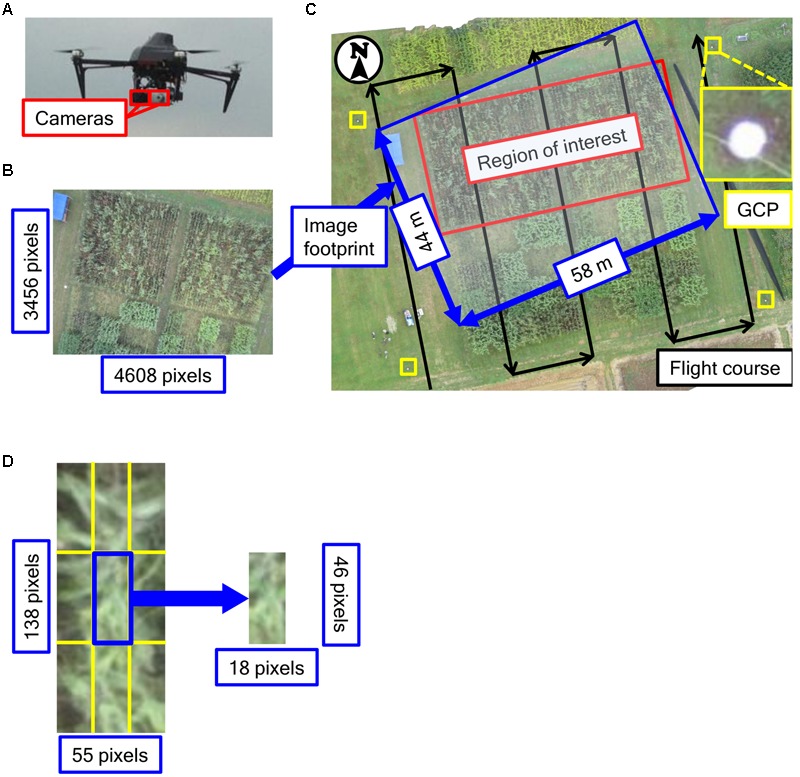
Unmanned aerial vehicle used. (A) Images of UAV used in the study, (B) An image taken in this study, (C) Outline of the flight course and (D) The size of one plot and one divided block. Positions of GCPs in the World Geodetic System were measured by using GPS.
To compare plant height measured with the UAV (PHUAV) and plant height measured with rulers (PHR), we performed a remote-sensing experiment on the first day of harvest (October 2). The weather on that day was cloudy. ISO sensitivity, which is an indicator of light sensitivity provided by the International Organization for Standardization (Vernier, Geneva, Switzerland), was set at 320 and shutter speed at 1/1,250 s for the RGB camera; ISO sensitivity was 800 and shutter speed was 1/800 s for the NIR-GB camera. The UAV was controlled by an autopilot system with GPS to fly along a pre-defined course designed by the PC Ground Station software (DJI Co., Ltd., Shenzheng, China). The outline of the flight course is shown in Figure 2B. The course was designed so that the vertical overlap of images was 70% and horizontal overlap was 30%. Photographs were taken at an altitude of 40 m, total flight time was about 10 min, and 30 photographs were taken. From an altitude of 40 m, the resolution was ca. 13 mm per pixel. A preliminary remote sensing experiment was performed on July 23 with the RGB camera NEX-7 (Sony Corporation, Tokyo, Japan; resolution, ca. 24 million pixels; sensor size, 23.5 mm × 15.6 mm) with a lens of focal length 20 mm. The following parameters were used in the preliminary experiment: ISO sensitivity, 100; shutter speed, 1/800 s; altitude, 50 m; 78 photographs were taken. From an altitude of 50 m, the resolution was ca. 10 mm per pixel. Because plants were still small on June 23, we used the data collected on July 23 to obtain DSM data on the ground surface of the field. Although NEX-7 has higher resolution than PowerShot ELPH 110HS, it is heavier and thus we could not mount two types of cameras (RGB and NIR) simultaneously on the UAV. At an altitude of 40 m, the resolution of PowerShot ELPH 110HS was similar to that of NEX-7. Therefore, we used PowerShot ELPH 110HS for remote sensing.
Image Processing
Both RGB and NIR-GB images were analyzed in the same way. By using the in-house structure-from-motion software Nadir-metry (Air4D Co., Ltd., Tokyo, Japan), ortho-mosaic images and DSM data were constructed from images taken by the UAV with the geographic coordinates of GCPs. Although the structure-from-motion algorithm of Nadir-metry is similar to that in other software, it has some advantages in feature point matching and generating point clouds. In the algorithm of Nadir-metry, feature point matching is performed by taking into account the correspondence between overlapping images estimated from their geographic coordinates. As a result, spatial skew hardly occurs. In the generation of point clouds, all pixels were analyzed to detect matching points. This decreased the number of missing matches and prevented point clouds from being sparse. Because DSM values were calculated based on the World Geodetic System 1984 and they did not directly reflect the ground height of objects, we estimated the height of sorghum plants by subtracting the DSM values of the ground surface of the field on July 23 from the DSM values on October 2, as in Bendig et al. (2013). From the location of each plot determined on the ortho-mosaic image, we obtained PHUAV for each plot from the DSM data. Because adjacent plots were close to each other, DSMs of plot boundaries were contaminated with data originated from adjacent plots, and might have higher error than those inside a plot. To exclude marginal areas, we divided each plot into 9 blocks (3 × 3) and analyzed only the central block. That is, the plot size was 0.72 m × 1.8 m and corresponded to ca. 55 × 138 pixels (Figure 2D) at a resolution of 13 mm per pixel in DSM. The size of the central block was 0.24 m × 0.6 m, corresponding to ca. 18 × 46 pixels of DSM (Figure 2D). Each pixel had a DSM value that was construed as the altitude of the location. We calculated the 50th (median), 75th, 90th, and 99th percentiles of DSM values of the central block as the representative values of PHUAV for the plot. We evaluated the accuracy of PHUAV from its correlation coefficients with PHR and also from root mean square difference (RMSD):
where PHUAV, i and PHR, i are the PHUAV value and the PHR value of the ith plot, respectively.
Treatment of Unexpected Values
We assumed that if a plot of a tall accession and that of a small accession were adjacent in the field, the plants of the small accession might be overlapped by those of the tall accession on images, and DSMs of the small accession might be overestimated because they were strongly contaminated by data originated from the tall accession. To confirm this, we compared the correlation between PHUAV and PHR under three conditions: (1) using data of the replication with higher PHUAV value for each accession; (2) using data of the replication with lower PHUAV value for each accession; (3) using average PHUAV value of two replications for each accession. As described later, the result using the lower PHUAV was better than others, and the replication with lower PHUAV value for each accession was used in the following analysis.
Genomic Prediction Modeling
We built genomic prediction models for both PHUAV and PHR, and compared the predicted values. To obtain DNA polymorphism data, we used restriction site-associated DNA sequencing (RAD-Seq; Baird et al., 2008); which is cheaper than whole genome sequencing especially for analysis of DNA polymorphism of large number of accessions. We obtained the data for 66,132 SNPs in 151 accessions (Supplementary Table 1). Genomic best linear unbiased prediction (G-BLUP) using rrBLUP (Endelman, 2011) was used for the modeling. To calculate predicted values for the 151 accessions and compare them for PHUAV and PHR, we performed leave-one-out cross-validation. In cross-validation, a model built with the PHUAV or PHR data of 150 of the 151 accessions was used to predict the PHUAV or PHR values of the remaining accession from its DNA polymorphism data. By comparing the observed and predicted values of both PHUAV and PHR, we evaluated whether manual measurements (PHR) can be replaced with the measurements using UAV remote sensing (PHUAV) in the collection of data for building a model.
Results
Image Processing and Measurement of Plant Height via UAV Remote Sensing
For both RGB and NIR-GB cameras, ortho-mosaic images and DSM heat maps of the experimental field before harvest were constructed by using 30 remote-sensing images taken on October 2 (Figure 3).
FIGURE 3.
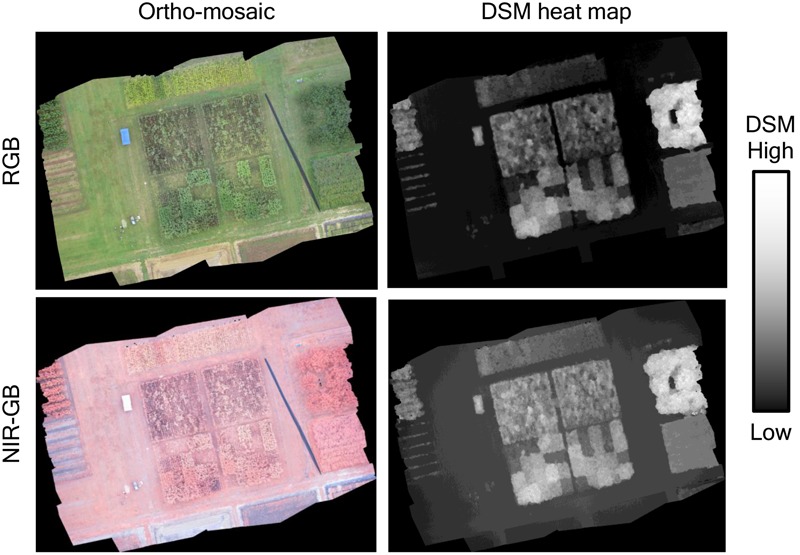
Ortho-mosaic and DSM heat map of October 2. Upper images were originated from the standard RGB cameras and lower images were originated from the NIR-GB (near-infrared, green, blue) camera. DSM provides information of the altitude. The resolution was ca. 13 mm per pixel. The sizes of both the ortho-mosaic and DSM were 10,701 × 8,061 pixels in RGB and 10,749 × 8,041 in NIR-GB; the ortho-mosaic and DSM were built from 30 images (4,608 × 3,456 pixels each).
To assess the accuracy of plant height measurements, we compared the correlation between PHUAV and PHR obtained with the two cameras at the 50th, 75th, 90th, and 99th percentiles of DSM values (Figure 4). Although there was no significance between two correlation coefficients (RGB vs. NIR-GB) at any combinations, correlation coefficients were higher for the NIR-GB than for RGB camera: 0.523 vs. 0.518 (50th percentile), 0.507 vs. 0.504 (75th), and 0.496 vs. 0.491 (90th). However, correlation coefficients were higher for RGB (0.475) than for NIR-GB (0.473) at the 99th percentile. RMSD between PHUAV and PHR was lower for the NIR-GB than RGB camera: (0.649 vs. 0.883 (50th percentile), 0.626 vs. 0.827 (75th), 0.628 vs. 0.792 (90th), and 0.665 vs. 0.759 (99th). PHUAV obtained from the RGB camera underestimated PHR because the points were distributed below the y = x line in Figure 4. PHUAV obtained from the NIR-GB camera estimated PHR more accurately, especially at the 90th and 99th percentiles, as evidenced by smaller RMSD in RGB than in NIR-GB.
FIGURE 4.
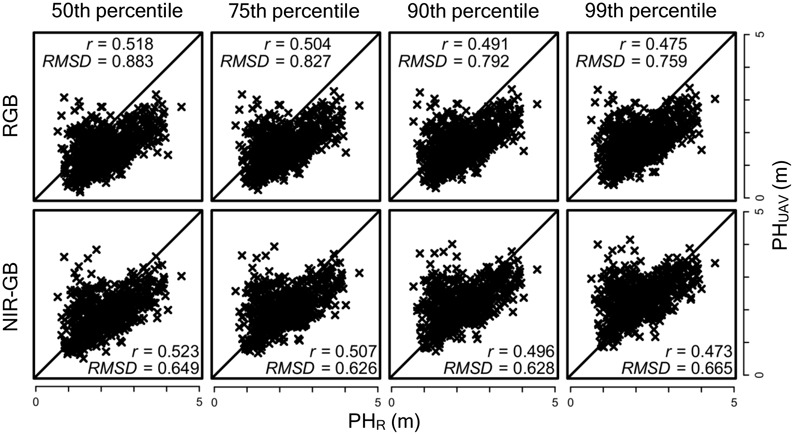
Accuracy under different cameras and different percentiles of DSM. The diagonal line indicates y = x; r, correlation coefficient; RMSD, root mean square difference. PHUAV is the plant height measured with the UAV and PHR is that with rulers. PHUAV values were calculated as 50th, 75th, 90th, and 99th percentile of DSM values in each plot.
The relationship between PHUAV and PHR suggested that PHUAV was overestimated at PHR values of <2.0 m (Figure 4). To assess whether the presence of taller plants on adjacent plots resulted in overestimation, we calculated two types of ratio for each plot as follows:
where PHR, i and PHUAV, i are the PHR and PHUAV values of the ith plot, respectively, and N = 8 in this case. PHR, i, k is the PHR value of the kth (1–8) plot adjacent to the ith plot. The ratio r1 represents the degree of height difference among the plants on adjacent plots. The ratio r2 represents the degree of over- or under- estimation of PHUAV against PHR. A scatter plot of these ratios for one combination (NIR-GB camera and the 50th percentile of DSM values) is shown in Supplementary Figure 1A; the results for other combinations were similar. Theoretically, the PHUAV/PHR ratio is expected to be approximately constant if UAV measurements are accurate, because both PHUAV and PHR are expected to be the true values of plant height (with measurement errors). If we regarded PHR as the true plant height, the PHUAV/PHR ratio became large, i.e., the PHUAV was overestimated against PHR (Supplementary Figure 1A) when PHR on adjacent plots was 1.5 times that on the central plot. This result suggests that the presence of taller plants on an adjacent plot prevents accurate construction of the DSM of the target plot because of the overlapping effect.
We analyzed the relationships between PHUAV and PHR for all the combinations of the two cameras and four percentile values separately for each of two replications (one with the lower PHUAV value, the other one with the higher PHUAV value) and the average (Figure 5). For all combinations, the correlation coefficients were highest (around 0.65) for the replications with lower PHUAV values and lowest (around 0.40) for the replications with higher PHUAV values. Correlation coefficients with lower PHUAV were significantly higher than those with mean PHUAV at significant level of 10% at all combinations. This result suggested that the lower PHUAV values were more reliable.
FIGURE 5.
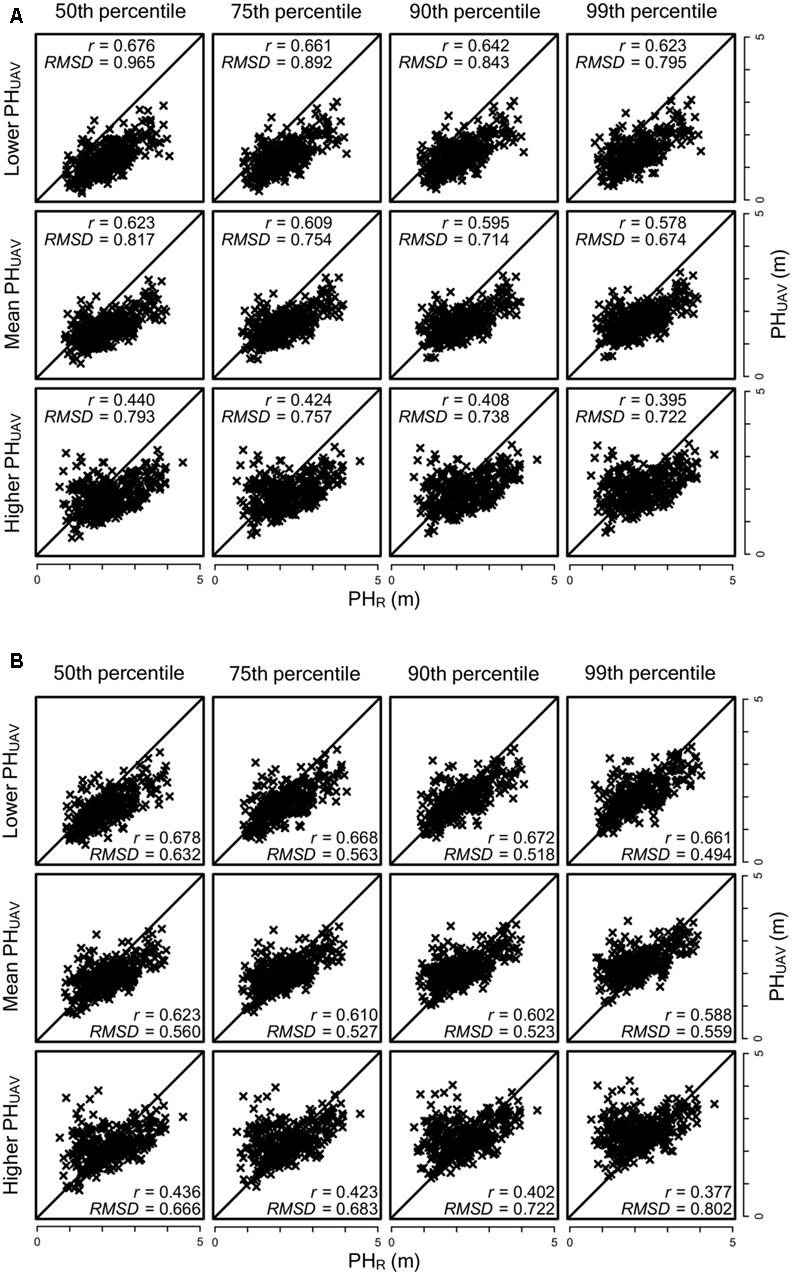
Comparison of lower, high and average PHUAV from two replications. (A) RGB camera and (B) NIR-GB camera. The diagonal line indicates y = x; r, correlation coefficient; RMSD, root mean square difference.
Genomic Prediction Modeling
To evaluate the accuracy of genomic prediction for PHUAV and PHR and the agreement between their predicted values, we obtained these values via leave-one-out cross- validation for all sorghum accessions cultivated under normal and low fertilization conditions. The relationships between the observed and predicted PHUAV and PHR values are shown in Figure 6. If the combination of two cameras and four representative values is different, the combination of selected replications for each fertilization condition is also different. For example, we consider two combinations: (i) (PHUAV of replication 1) < (PHUAV of replication 2) for accession A and (PHUAV of replication 1) < (PHUAV of replication 2) for accession B in a combination of two cameras and four percentiles of DSM values (combination 1), and (ii) (PHUAV of replication 1) < (PHUAV of replication 2) for accession A and (PHUAV of replication 1) > (PHUAV of replication 2) for accession B in another combination (combination 2). Then, for accession A, replication 1 is selected as the plot with the lower PHUAV value in both combinations, whereas for accession B replication 1 is selected in combination 1 and replication 2 is selected in combination 2 as the plot with lower PHUAV value. The same combinations of replications were also used for PHR. However, the combinations of replications were almost the same between different combinations of two cameras and four percentiles. Because of this, the results of PHR prediction with different cameras and different percentiles were similar to each other. The combinations with the highest and the lowest correlation coefficients are shown in Figure 6 for PHR prediction. Under normal fertilization, correlation coefficients between observed and predicted PHUAV were less than 0.5 (range, 0.448–0.492) for all combinations of the type of cameras and the percentiles of DSM, whereas those for PHR ranged from 0.629 to 0.675. Correlation coefficients for PHUAV were higher under low fertilization than under normal fertilization in all combinations. Although almost all combinations had lower correlation coefficients for PHUAV than for PHR, the correlation coefficient for PHUAV in the combination of NIR-GB and 50th percentile was as high as that for PHR (Figure 6). Predicted PHUAV and predicted PHR highly correlated with each other in all combination, (correlation coefficients ≥ 0.66 under low fertilization and ≥0.78 under normal fertilization except for one combination; Figure 7).
FIGURE 6.
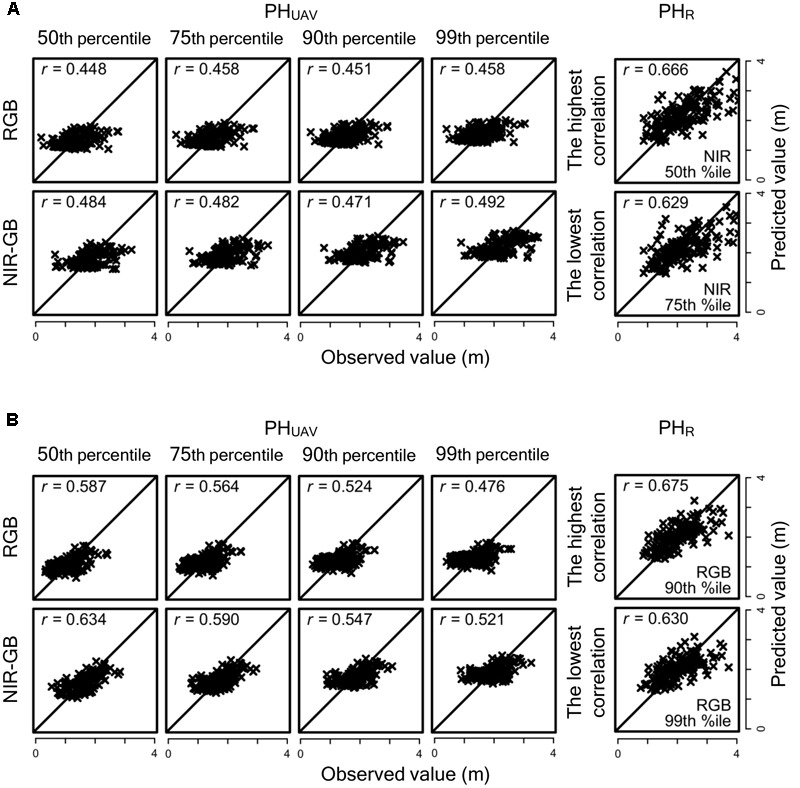
Relationships between observed and predicted PHUAV and PHR values in genomic prediction under normal and low fertilization conditions. (A) Normal fertilization and (B) Low fertilization. r, correlation coefficient. For PHR, only the combinations the highest and lowest correlation coefficients are shown.
FIGURE 7.
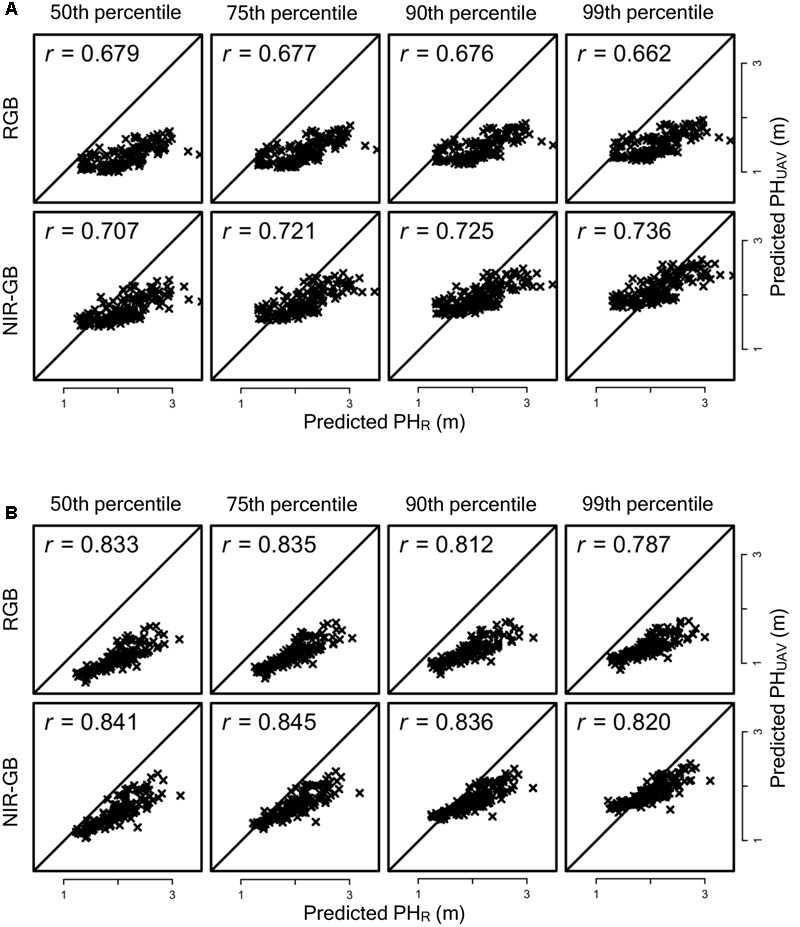
Relationships between predicted PHR and predicted PHUAV under normal fertilization and low fertilization condition. (A) Normal fertilization and (B) Low fertilization. r, correlation coefficient.
Discussion
We introduced UAV remote sensing for high-throughput measurement of sorghum plant height, and applied it to genomic prediction modeling. The results of this study suggest the potential of UAV remote sensing for the high-throughput phenotyping of plant height in sorghum. Some sorghum genotypes are too tall to measure the height of the plants without harvesting them. Our approach would not only decrease labor cost but would also allow observation of plant growth over time. Traditionally, all accessions are measured only once, although their growth stages at the measurement time may differ. Our remote sensing approach would allow comparison of accessions at the same growth stage.
Using UAV remote sensing, we could not measure sorghum plant height as accurately as that of barley (which is smaller than sorghum) measured by Bendig et al. (2014). One reason may be that tall sorghum plants overlap (Supplementary Figure 1). Another reason may be low plant density: 3.9 plants/m2 vs. 300 plants/m2 in Bendig et al. (2014); we can see the sparseness of plants in a plot in Figure 1. If plant density is high enough to form a continuous canopy, most of the matched points are captured from the canopy and DSM reflects plant height precisely. However, because of the sparseness, matched points included not only the top of canopy but also the ground or lower parts of plants. This could cause errors on DSM in plant height measurement. Increasing plot size and plant density may improve the measurement accuracy. We can easily measure plant height multiple times with UAV remote sensing, which would probably also reduce measurement error. An important point is that the predicted PHUAV values were highly correlated with the predicted values of PHR, even though the correlation between the observed values of PHUAV and PHR was not high. This is because the observed values of PHUAV and PHR had different types of errors (e.g., errors from manual measurements and UAV measurements). Higher correlation between the predicted values suggests that they were less affected by errors than observed values. If we can reduce the measurement errors of UAV remote sensing by improving technologies or by repeating measurements, UAV remote sensing will perform better than manual measurements for genomics-assisted breeding.
We also found that using the lower value of PHUAV of the two replications for each association seemed to reduce the overlapping effect (Figure 5). For the replications with the lower value PHUAV values, the correlation coefficients of PHUAV and PHR were not largely different for the RGB and NIR-GB cameras. The RGB camera underestimated PHUAV and the RMSD value of this camera was higher than that of the NIR-GB camera. For genomic prediction modeling, the correlation coefficients between observed and predicted values were higher for NIR-GB than RGB (Figures 6, 7), indicating that NIR-GB was slightly superior for this purpose. Only the combination of NIR-GB and 50th percentile under low fertilization resulted in a correlation coefficient between observed and predicted values for PHUAV close to that for PHR (Figure 6). Prediction of plant height was less accurate under normal than under low fertilization. This may suggest that the overlapping effect was stronger when plants were larger. NIR-GB was better than RGB under both fertilization conditions. Like in crop identification (Zhang et al., 2016) and in monitoring of plant condition (Nijland et al., 2014), a NIR sensor may perform better than a standard RGB sensor for remote sensing in plant breeding.
In the case of the NIR-GB camera, the correlation coefficient was the highest at the 50th percentile of DSM values, whereas the RMSD value was the lowest at the 99th percentile. At the 99th percentile, PHUAV was almost the same as PHR. RMSD became higher, but the number of outliers also increased, which reduced the correlation coefficient. At the 50th percentile, the number of outliers was low in PHUAV measurements and the correlation coefficient became higher, but the difference between the PHUAV and PHR values increased and RMSD became lower. There is probably a trade-off between the correlation coefficient and RMSD. If accurate plant height measurements are required, PHUAV at the 99th percentile of DSM will perform well. In this study, PHUAV at the 50th percentile of DSM was better than at other percentile values regarding the accuracy of both plant height measurements and genomic prediction modelings.
The collection of PHUAV data required 3 people × 10 min, while collection of PHR data required over 10 people × 2 days. Because GS and GWAS require phenotyping of a large number of accessions or plants, UAV remote sensing will be an important and indispensable tool for high-throughput genomic-assisted plant breeding.
Using digital cameras, we can measure canopy cover from images taken right above the plants (Purcell, 2000) and relate it to plant density, early vigor, leaf size, and radiation interception (Liebisch et al., 2015). Using NIR sensors, we can measure NDVI of the canopy and relate it to canopy biomass and nitrogen status (Hansen and Schjoerring, 2003). Using thermal sensors, we can measure canopy temperature (Berni et al., 2009) and relate it to water stress (Jackson et al., 1981).
Not all of the studies used UAV remote sensing. However, by attaching appropriate sensors to an UAV, we can obtain various types of information from plants grown in the field and measure important target trait-related characteristics. Combination of machine learning and image analysis enables the evaluation of complex traits, such as flowering date (Guo et al., 2015). In the future, various kinds of plant phenotyping data will be measured in parallel and in a high-throughput manner by UAV remote sensing.
Author Contributions
KW, TF, NT, and HI planned and designed the experiments. TT and NT contributed to the preparation of materials. KW, WG, and KA performed remote sensing experiments. HT performed the RAD-Seq experiment, and MK, HK-K, and KY analyzed the RAD-Seq data. KW performed other analyses, interpreted results, and drafted the manuscript with the contributions from WG, KA, and HI. NT obtained funding for the study. HI supervised the study. All authors read and approved the final manuscript.
Conflict of Interest Statement
The authors declare that the research was conducted in the absence of any commercial or financial relationships that could be construed as a potential conflict of interest.
Acknowledgments
The authors thank the technical support staff at the Institute of Sustainable Agro-ecosystem Services, The University of Tokyo for their help in field experiments.
Footnotes
Funding. The research was funded by CREST, Japan Science and Technology Agency, Japan (research subject: “Novel techniques of tailor-made breeding for energy crop improvement using high-throughput genotyping”).
Supplementary Material
The Supplementary Material for this article can be found online at: http://journal.frontiersin.org/article/10.3389/fpls.2017.00421/full#supplementary-material
References
- Baird N. A., Etter P. D., Atwood T. S., Currey M. C., Shiver A. L., Lewis A. L., et al. (2008). Rapid SNP discovery and genetic mapping using sequenced RAD markers. PLoS ONE 3:e3376 10.1371/journal.pone.0003376 [DOI] [PMC free article] [PubMed] [Google Scholar]
- Bendig J., Bolten A., Bennertz S., Broscheit J., Eichfus S., Bareth G. (2014). Estimation biomass of barley using crop surface models (CMSs) derived from UAV-based RGB imaging. Remote Sens. 6 10395–10412. 10.3390/rs61110395 [DOI] [Google Scholar]
- Bendig J., Bolton A., Bareth G. (2013). UAV-based imaging for multi-temporal, very high resolution crop surface models to monitor crop growth variability. PFG. 6 551–562. [Google Scholar]
- Berger B., Parent B., Tester M. (2010). High-throughput shoot imaging to study drought response. J. Exp. Bot. 261 3519–3528. 10.1093/jxb/erq201 [DOI] [PubMed] [Google Scholar]
- Berni J. A. J., Zarco-Tejada P. J., Suárez L., Fereres E. (2009). Thermal and narrowband multispectral remote sensing for vegetation monitoring from an unmanned aerial vehicle. IEEE Trans. Geosci. Remote Sens. 47 722–738. 10.1109/TGRS.2008.2010457 [DOI] [Google Scholar]
- Brachi B., Morris G. P., Borevitz J. O. (2011). Genome-wide association studies in plants: the missing heritability is in the field. Genome Biol. 12:232 10.1186/gb-2011-12-10-232 [DOI] [PMC free article] [PubMed] [Google Scholar]
- Cabrera-Bosquet L., Moloero G., Stellacci A. M., Bort J., Nogués S., Araus J. L. (2011). NDVI as a potential tool for predicting biomass, plant nitrogen content and growth in wheat genotypes subjected to different water and nitrogen conditions. Cereal Res. Commun. 39 147–159. 10.1556/CRC.39.2011.1.15 [DOI] [Google Scholar]
- Chapman S., Merz T., Chan A., Jackway P., Hrabar S., Dreccer M. F., et al. (2014). Pheno-copter: a low-altitude, autonomous remote-sensing robotic helicopter for high-throughput field-based phenotyping. Agronomy 4 279–301. 10.3390/agronomy4020279 [DOI] [Google Scholar]
- Colomina I., Molina P. (2014). Unmanned aerial systems for photogrammetry and remote sensing: a review. ISPRS J. Photogramm. Remote Sens. 92 79–97. 10.1016/j.isprsjprs.2014.02.013 [DOI] [Google Scholar]
- Davey J. W., Hohenlohe P. A., Etter P. D., Boone J. Q., Catchen J. M., Blaxter M. L. (2011). Genome-wide genetic marker discovery and genotyping using next-generation sequencing. Nat. Rev. Genet. 12 499–510. 10.1038/nrg3012 [DOI] [PubMed] [Google Scholar]
- Díaz-Varela R. A., de la Rosa R., León L., Zarco-Tejata P. J. (2015). High-resolution airborne UAV imagery to assess olive tree crown parameters using 3D photo reconstruction: application in breeding trials. Remote Sens. 7 4213–4232. 10.3390/rs70404213 [DOI] [Google Scholar]
- Endelman J. B. (2011). Ridge regression and other kernels for genomic selection with R package rrBLUP. Plant Genome 4 250–255. 10.3835/plantgenome2011.08.0024 [DOI] [Google Scholar]
- Fahlgren N., Gehan M. A., Baxter I. (2015). Lights, camera, action: high-throughput plant phenotyping is ready for a close-up. Curr. Opin. Plant Biol. 24 93–99. 10.1016/j.pbi.2015.02.006 [DOI] [PubMed] [Google Scholar]
- Furbank R. T., Tester M. (2011). Phenomics-technologies to relieve the phenotyping bottleneck. Trends Plant Sci. 16 635–644. 10.1016/j.tplants.2011.09.005 [DOI] [PubMed] [Google Scholar]
- Gini R., Pagliari D., Passoni D., Pinto L., Sona G., Dosso P. (2013). UAV photogrammetry: block triangulation comparisons. Int. Arch. Photogram. Remote Sens. Spat. Inf. Sci. Volume XL-1/W2 157–162. 10.5194/isprsarchives-XL-1-W2-157-2013 [DOI] [Google Scholar]
- Guo W., Fukatsu T., Ninomiya S. (2015). Automated characterization of flowering dynamics in rice using field-acquired time-series RGB images. Plant Methods 11:7 10.1186/s13007-015-0047-9 [DOI] [PMC free article] [PubMed] [Google Scholar]
- Hansen P. M., Schjoerring J. K. (2003). Reflectance measurement of canopy biomass and nitrogen status in wheat crops using normalized difference vegetation indices and partial least square regression. Remote Sens. Environ. 86 542–553. 10.1016/S0034-4257(03)00131-7 [DOI] [Google Scholar]
- Huang X., Han B. (2014). Natural variation and genome-wide association studies in crop plants. Ann. Rev. Plant Biol. 65 531–551. 10.1146/annurev-arplant-050213-035715 [DOI] [PubMed] [Google Scholar]
- Inoue Y. (1997). Remote sensing of crop and vegetative environment (Part 2). J. Japan Remote Sens. Soc. 17 57–67. [Google Scholar]
- Jackson R. D., Idso S. B., Reginato R. J., Pinter P. J., Jr. (1981). Canopy temperature as a crop water stress indicator. Water Resour. Res. 17 1133–1138. 10.1029/WR017i004p01133 [DOI] [Google Scholar]
- Jannink J. L., Lorenz A. J., Iwata H. (2010). Genomic selection in plant breeding: from theory to practice. Brief. Funct. Genomics 9 166–177. 10.1093/bfgp/elq001 [DOI] [PubMed] [Google Scholar]
- Knipling E. B. (1970). Physical and physiological basis for the reflectance of visible and near-infrared radiation from vegetation. Remote Sens. Environ. 1 155–159. 10.1016/S0034-4257(70)80021-9 [DOI] [Google Scholar]
- Korte A., Farlow A. (2013). The advantage and limitations of trait analysis with GWAS: a review. Plant Methods 9:29 10.1186/1746-4811-9-29 [DOI] [PMC free article] [PubMed] [Google Scholar]
- Lee W., Searcy S. (1999). “Multispectral sensor for detecting nitrogen in corn plants,” in Proceedings of the 2000 ASAE Annual International Meeting. Paper No. 001010 Milwaukee, WI. [Google Scholar]
- Liebisch F., Kirchgessner N., Schneider D., Walter A., Hund A. (2015). Remote, aerial phenotyping of maize traits with a mobile multi-sensor approach. Plant Methods 11:9 10.1186/s13007-015-0048-8 [DOI] [PMC free article] [PubMed] [Google Scholar]
- Mardis E. R. (2007). The impact of next-generation sequencing technology on genetics. Trends Genet. 24 133–141. 10.1016/j.tig.2007.12.007 [DOI] [PubMed] [Google Scholar]
- Merz T., Chapman S. (2011). “Autonomous unmanned helicopter system for remote sensing missions in 655 unknown environments,” in Proceedings of the International Conference on Unmanned Aerial Vehicle 656 in Geomatics (Zurich: ISPRS; ). [Google Scholar]
- Meuwissen T. H., Hayes B. J., Goddard M. E. (2001). Prediction of total genetic value using genome-wide dense marker maps. Genetics 157 1819–1829. [DOI] [PMC free article] [PubMed] [Google Scholar]
- Nijland W., de Jong R., de Jong S. M., Wulder M. A., Bater C. W., Coops N. C. (2014). Monitoring plant condition and phenology using infrared sensitive consumer grade digital cameras. Agric. For. Meteorol. 184 98–106. 10.1016/j.agrformet.2013.09.007 [DOI] [Google Scholar]
- Purcell L. C. (2000). Soybean canopy coverage and light interception measurements using digital imagery. Crop Sci. 40 834–837. 10.2135/cropsci2000.403834x [DOI] [Google Scholar]
- Rouse J. W., Haas R. H., Schell J. A., Deering D. W. (1974). “Monitoring vegetation systems in the Great Plains with ERTS,” in Proceedings of the Third ERTS-1 Symposium, NASA SP-351 (Washington, DC: NASA; ) 309–317. [Google Scholar]
- Sugiura R., Noguchi N., Ishii K. (2005). Remote-sensing technology for vegetation monitoring using an unmanned helicopter. Biosyst. Eng. 90 369–379. 10.1016/j.biosystemseng.2004.12.011 [DOI] [Google Scholar]
- Torres-Sánchez J., López-Granados F., Serrano N., Arquero O., Peña J. M. (2015). High-throughput 3-D monitoring of agricultural-tree plantations with unmanned aerial vehicle (UAV) technology. PLoS ONE 10:e0130479 10.1371/journal.pone.0130479 [DOI] [PMC free article] [PubMed] [Google Scholar]
- Tucker C. J. (1979). Red and photographic infrared linear combinations for monitoring vegetation. Remote Sens. Environ. 8 127–150. 10.1016/0034-4257(79)90013-0 [DOI] [Google Scholar]
- van Maarschalkerweerd M., Bro R., Egebo M., Husted S. (2013). Diagnosing latent copper deficiency in intact barley leaves (Hordeum vulgare, L.) using near infrared spectroscopy. J. Agric. Food Chem. 61 10901–10910. 10.1021/jf402166g [DOI] [PubMed] [Google Scholar]
- Zarco-Tejada P. J., Diaz-Varela R., Angileri V., Loudjani P. (2014). Tree height quantification using very high resolution and imagery acquired from an unmanned aerial vehicle (UAV) and 3D photo-reconstruction methods. Eur. J. Agronomy 55 89–99. 10.1016/j.eja.2014.01.004 [DOI] [Google Scholar]
- Zhang C., Kovacs J. M. (2012). The application of small unmanned aerial system for precision agriculture: a review. Precis. Agric. 13 693–712. 10.1007/s11119-012-9274-5 [DOI] [Google Scholar]
- Zhang J., Yang C., Song H., Hoffmann W. C., Zhang D., Zhang G. (2016). Evaluation of an airborne remote sensing platform consisting of two consumer-grade cameras for crop identification. Remote Sens. 8:257 10.3390/rs8030257 [DOI] [Google Scholar]
Associated Data
This section collects any data citations, data availability statements, or supplementary materials included in this article.


