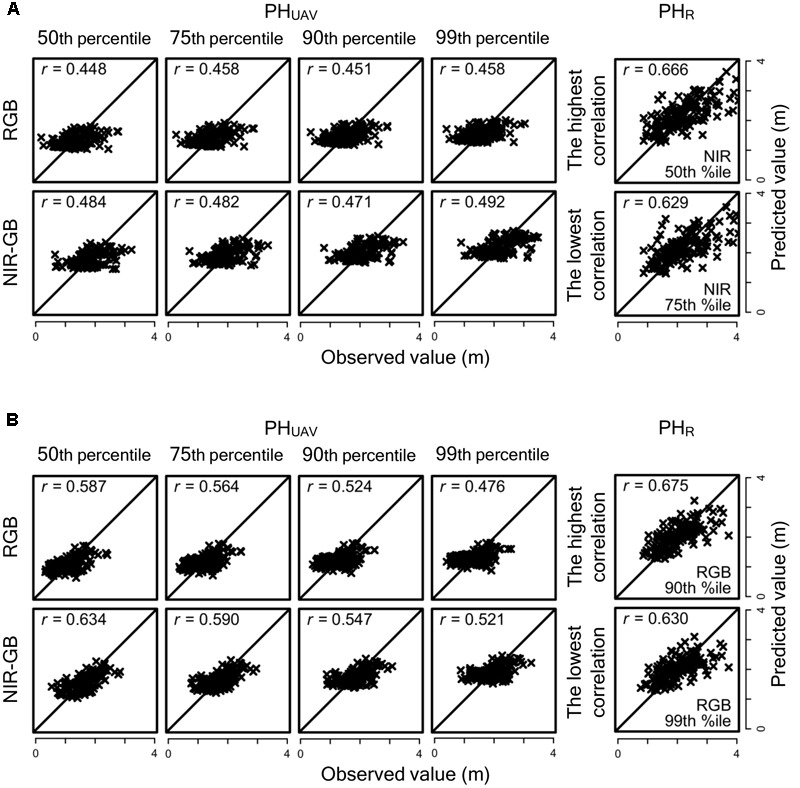
FIGURE 6.

Relationships between observed and predicted PHUAV and PHR values in genomic prediction under normal and low fertilization conditions. (A) Normal fertilization and (B) Low fertilization. r, correlation coefficient. For PHR, only the combinations the highest and lowest correlation coefficients are shown.
