
FIGURE 7.
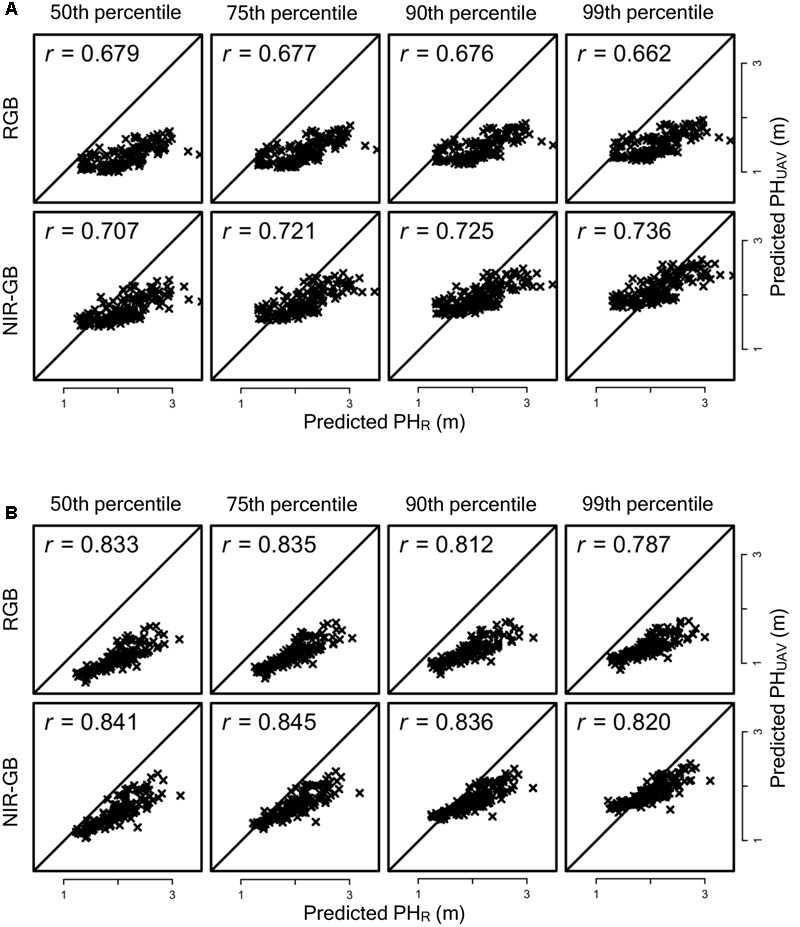
Relationships between predicted PHR and predicted PHUAV under normal fertilization and low fertilization condition. (A) Normal fertilization and (B) Low fertilization. r, correlation coefficient.
Official websites use .gov
A
.gov website belongs to an official
government organization in the United States.
Secure .gov websites use HTTPS
A lock (
) or https:// means you've safely
connected to the .gov website. Share sensitive
information only on official, secure websites.
Relationships between predicted PHR and predicted PHUAV under normal fertilization and low fertilization condition. (A) Normal fertilization and (B) Low fertilization. r, correlation coefficient.