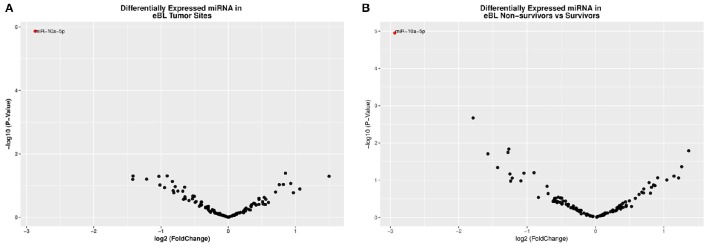
Figure 2.
(A) A volcano plot displaying the statistically significant (p < 0.01 and FDR < 0.1) results and shows the relationship between the significance of miRNAs detected and the fold-change between eBL jaw and abdominal tumors. miR-10a-5p showed 2.7-fold lower abundance in the jaw vs. abdominal tumors. The red colored circles represent miR-10a-5p which is differentially expressed with p < 0.01 and FDR < 0.02. The down-regulated miRNAs are signified by a negative fold-change value and vice versa. (B) A volcano plot representing the significance of miRNAs (−log of the p-value) vs. the fold change difference in eBL Non-survivors' vs. Survivors. Hsa-miR-10a-5p was also downregulated in the eBL non-survivors.

