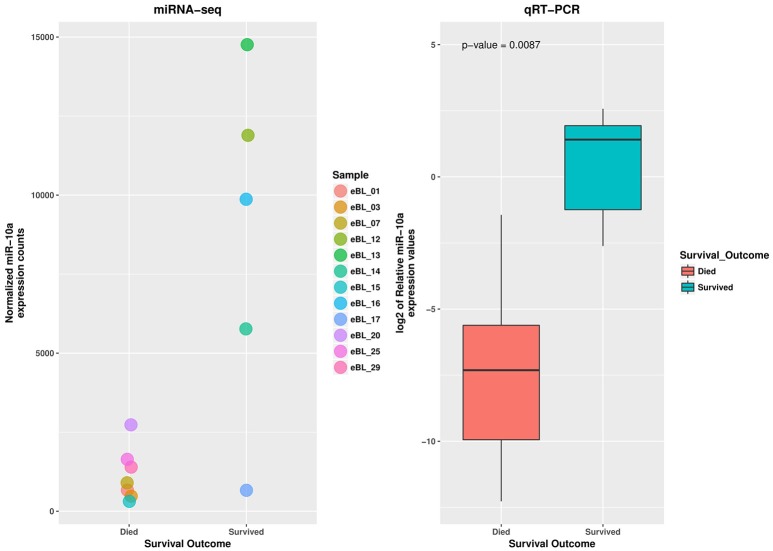
Figure 4.
qRT-PCR validation of miR-10a-5p expression difference in eBL survivors vs. non-survivor tumor samples. The jitter plot shows the normalized expression values from the miRNA sequencing experiment. The box plot shows the log2 median expression levels of miR-10a-5p, confirmed as downregulated in eBL non-survivor patients, estimated in terms of normalized fluorescence intensity.

