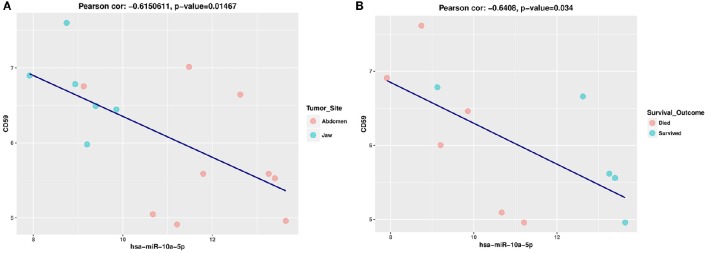
Figure 5.
(A) Pearson correlation scatter plot showing a negative correlation between hsa-miR-10a-5p and CD59 expression levels in eBL patients. The horizontal and vertical axis represents the log2-expression values of the miRNA and mRNA, respectively. These plots show the relationship between hsa-miR-10a-5p expression and CD59 expression levels in eBL patients based tumor site. (B) Pearson correlation scatter plot showing a negative correlation between hsa-miR-10a-5p and CD59 expression levels in eBL patients based on patient survival outcome. The horizontal and vertical axis represents the log2-expression values of the miRNA and mRNA, respectively. The plots show the relationship between hsa-miR-10a-5p expression and CD59 expression levels in eBL patients based on patient outcome.

