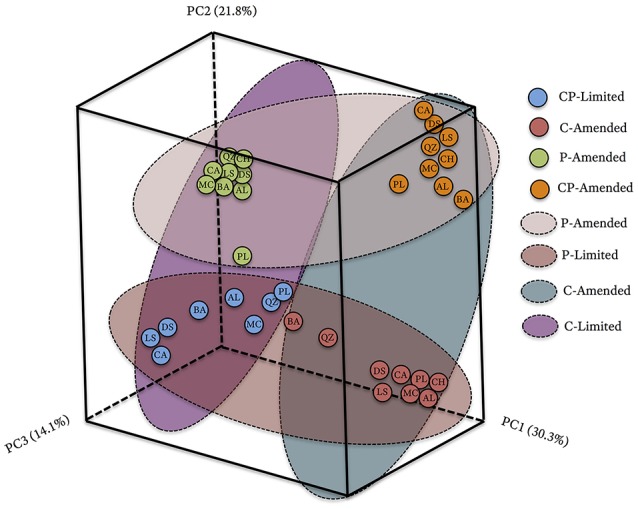
Figure 2.

Principal coordinate analysis (PCoA) plot based on the relative abundances and phylogenetic diversity of 16S rRNA gene sequences using a UniFrac weighted distance matrix, colored according to reactor treatment conditions and labeled according to solid substrate type; blue, CP-Limited; green, P-Amended; orange, CP-Amended; red, C-Amended. Percentage of the diversity distribution explained by each axis is indicated in the figure. The colored ellipses encircle variations in reactor treatment conditions.
