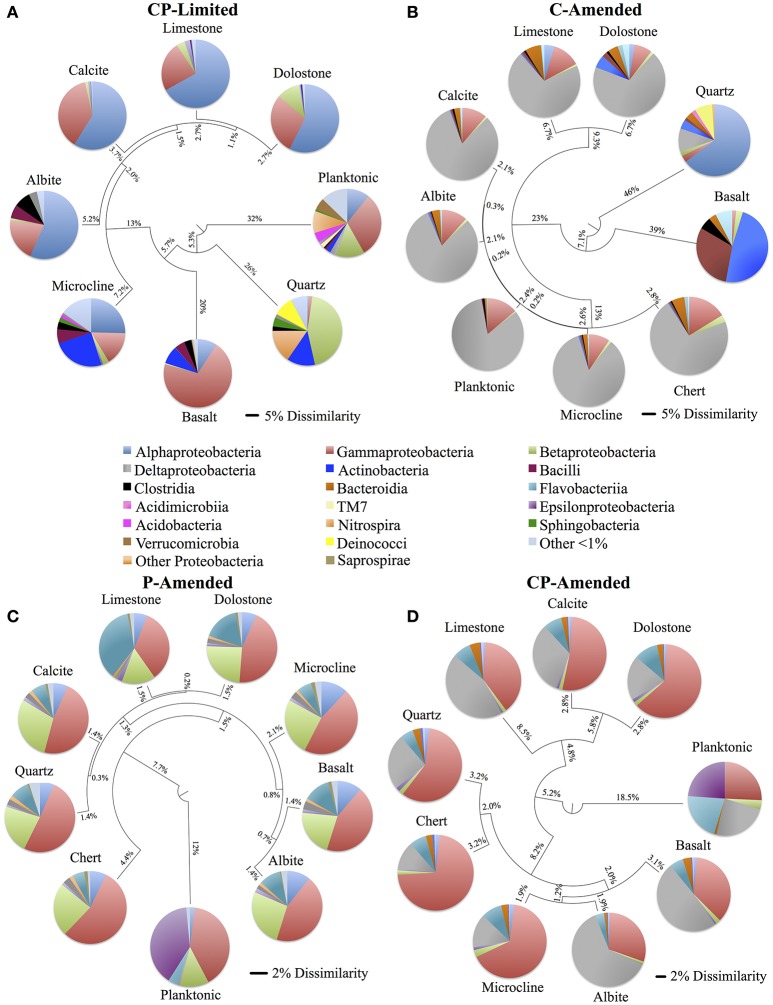
Figure 3.
Unweighted pair group method with arithmetic mean (UPGMA) trees constructed using weighted UniFrac (phylogenetic) distance matrix constructed from 16S rRNA sequences clustered at 97% similarity for each of the four reactor treatments (CP-Limited, P-Amended, C-Amended, CP-Amended). The trees display the phylogenetic overlap in bacterial communities colonizing various solid surfaces within each reactor treatment. The key (center) contains the class level taxonomy associated with each mineral surface (see Supplementary Tables 3–6 for proportional abundances). The scale bars for the CP-Limited and C-Amended treatments represents 0.05 (5%) dissimilarity in 16S rRNA sequences isolated from each surface and the scale bars for the P-Amended and CP-Amended treatments 0.02 (2%) dissimilarity. Note that although the taxonomy of the CP-Limited treatment is the same as Jones and Bennett (2014), the UPGMA tree here is based on UniFrac distances, while the tree in Jones and Bennett (2014; Figure 4) used the OTU based Sorenson similarity index.

