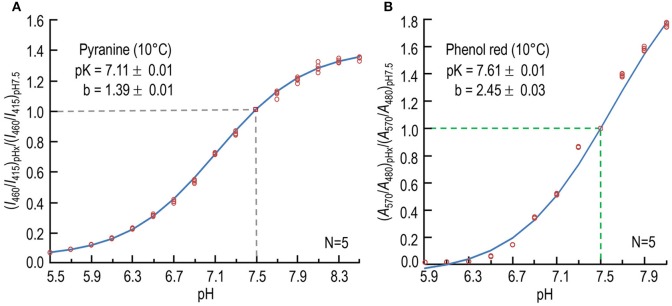
Figure 1.
Calibration of pH-sensitive dyes at 10°C. (A) Dependence of normalized fluorescence-excitation ratio of pyranine on pH. For each data point at one of 16 pH-values (pHx), we record the time course of fluorescence emission (≥488 nm) in the stopped-flow device separately at excitation wavelengths of 460 and 415 nm, first in the absence and then in the presence of dye, and obtain the background-subtracted ratio (I460/I415)pHx, as described in Section Materials and Methods. We then divide each (I460/I415)pHx by the value observed at pH 7.50 in that experiment to obtain the normalized fluorescence-excitation ratio (I460/I415)pHx/(I460/I415)pH7.5. The value 7.11 is the best-fit value for pK, and 1.39 is the best-fit value for the difference between the maximal and minimal asymptotic values of (I460/I415)pHx/(I460/I415)7.5. The data are from five sets of experiments. (B) Dependence of normalized absorbance ratio of phenol red on pH. For each data point at one of 12 pH-values (pHx), we record absorbance separately at the pH-sensitive wavelength of 570 nm and at the isosbestic wavelength of 480 nm. After subtracting the background at each incident wavelength, we obtain the ratio (A570/A480)pHx. We then normalize each (A570/A480)pHx to the value observed at pH 7.50 in that experiment, as described in Section Materials and Methods. The data are from five sets of experiments. In both (A,B), we show each individual point, some of which overlie other. N is the number of experiments in each experiment, we obtained data for each pH. The curves through the points—and the pK and b-values (±SD)—are the result of non-linear least-squares calculations.

