Figure 4.
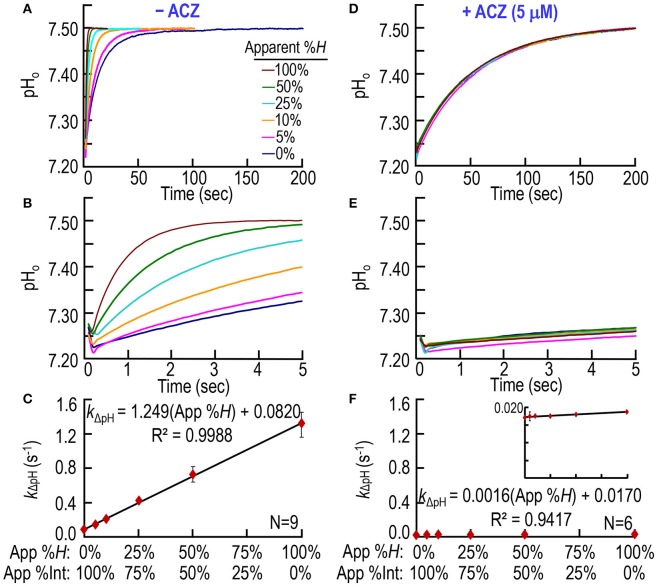
CA assays on mixtures of intact and hemolyzed RBCs. (A) Time courses of pH from 0 to 200 s, for degrees of apparent percent hemolysis ranging from 0 to 100%. We added the hemolysate/RBC mixture to solution A (Table 1) and derived pH-values from the fluorescence of pyranine, added to solution B. We created all solutions by mixing different ratios of 100% hemolysate and ostensibly 100% intact RBCs, so that the hemoglobin concentration in the reaction cell was always ~2.5 μM. (B) Time courses from 0 to 5 s, representing the same records as in (A). (C) Dependence of the rate constant of the pH change on apparent percent hemolysis (App %H), which is inversely related to apparent percent intact RBCs (App %Int). We obtained kΔpH-values from non-linear least-squares curve fits of data like those in (A,B). (D) Effect of acetazolamide on time courses of pH from 0 to 200 s for apparent percent hemolysis ranging from 0 to 100%. These experiments are like those in (A), except that we added 10 μM ACZ to solution B (Table 1). (E) Time courses from 0 to 5 s, representing the same records as in (D). (F) Dependence of kΔpH on apparent %H (inversely related to apparent percent intact RBCs) in the presence of ACZ. Each data point represents mean ± SD (error bar not shown if smaller than the symbol). N represents the number of independent experiments, each covering six hemolysis/RBC mixtures (App %H: 0–100%, App %Int: 100–0%).

