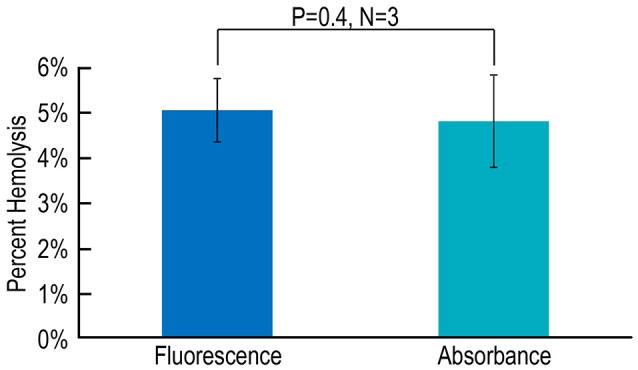
Figure 6.

Assessing hemolysis by fluorescence vs. absorbance spectroscopy. Each N represents blood from one mouse, analyzed in parallel using both a fluorescence-based assay with pyranine and an absorbance-based assay with phenol red. Values are means ± SD, evaluated using a two-tailed paired student's t-test.
