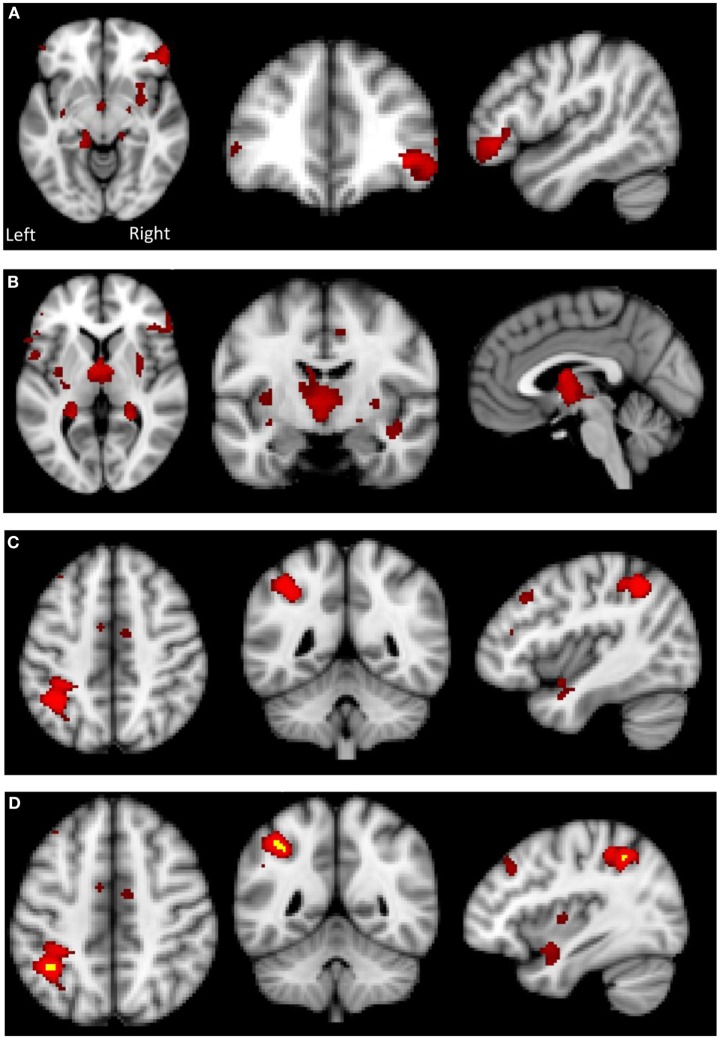
Figure 5.
Top: gray matter (GM) reduction in the anorexia nervosa (AN) group compared to HC in (A) the lateral prefrontal cortex, (B) putamen and thalamus, (C) left supramarginal gyrus/superior parietal lobule. Bottom: (D) overlap in GM reduction in the AN group (red) and the AN-R group (yellow) in the left supramarginal gyrus/superior parietal lobule.

