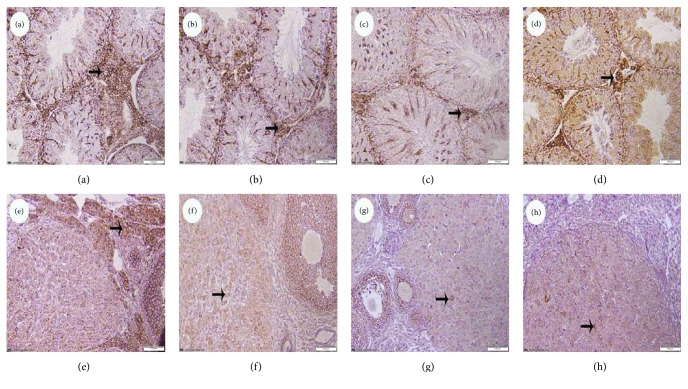
Figure 3.
The expression of Bcl-2 in testicular and ovary tissues of offspring mice in BPA group (Bar = 100 μm). (a)–(d) show the testicular tissues: (a) control group; (b) 50 mg/kg BW BPA; (c) 500 mg/kg BW BPA; (d) 2500 mg/kg BW BPA; (e)–(h) show the ovarian: (e) control group; (f) 50 mg/kg BW BPA; (g) 500 mg/kg BW BPA; (h) 2500 mg/kg BW BPA. Bcl-2 positive cells were pointed by arrows.

