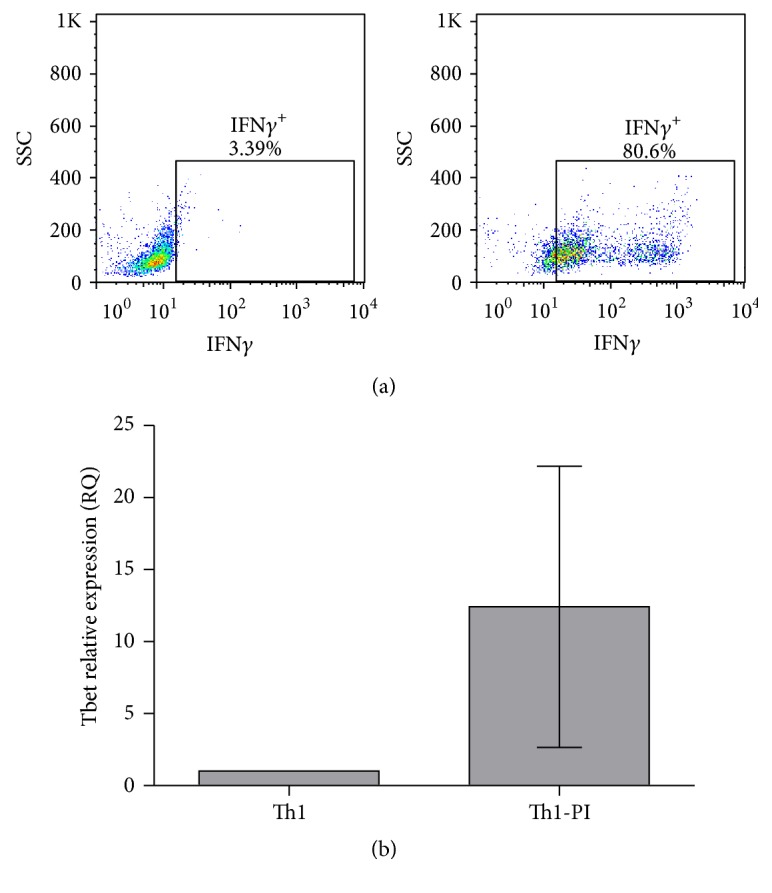
Figure 1.

Assessment of Th1 polarisation. (a) Flow cytometry dot plots represent the IFNγ production against the size scatter of Th1-polarised cells without (Th1) or with PI treatment (Th1-PI). The percentage of IFNγ producing cells is indicated. A representative experiment is shown. (b) Determination of the RQ of the transcription factor Tbet in naïve and Th1 cells. The average and the standard deviations of 3 donors are shown.
