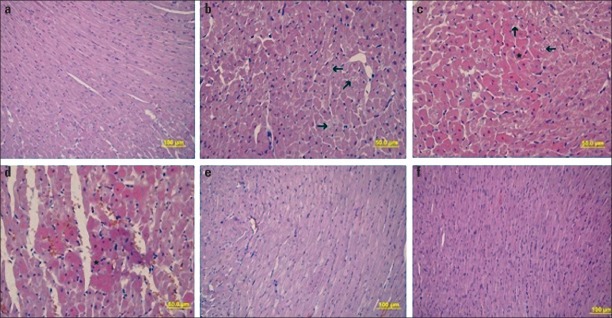
Figure 1.
a-f. H&E staining of heart tissue. (a) control group, (b-d) doxorubicin group, e) metformin group, f) doxorubicin + metformin group. The arrows show disorganization between myocardium muscle fibers, and loss of myofibrils in some cells, respectively. (*) indicates the myocardium layer and intracytoplasmic vacuole formation

