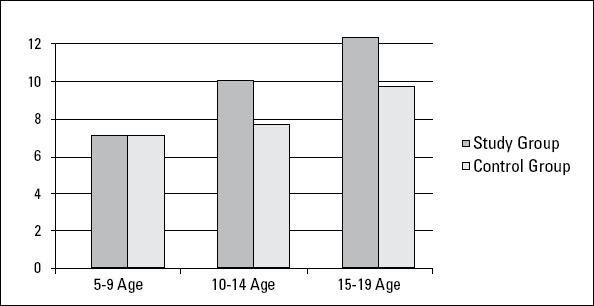
Figure 1.

Comparison of the groups according to homocysteine levels
The Pearson chi-square test was employed for cross-table analysis.
p=0.768 betwenn under 10 years of age
p=0.002 betwenn 10-14 years of age
p=0.003 betwenn 15-19 years of age

Comparison of the groups according to homocysteine levels
The Pearson chi-square test was employed for cross-table analysis.
p=0.768 betwenn under 10 years of age
p=0.002 betwenn 10-14 years of age
p=0.003 betwenn 15-19 years of age