
Figure 3. Standard curve generated when simultaneously detecting Salmonella typhimurium and Vibrio parahaemolyticus.
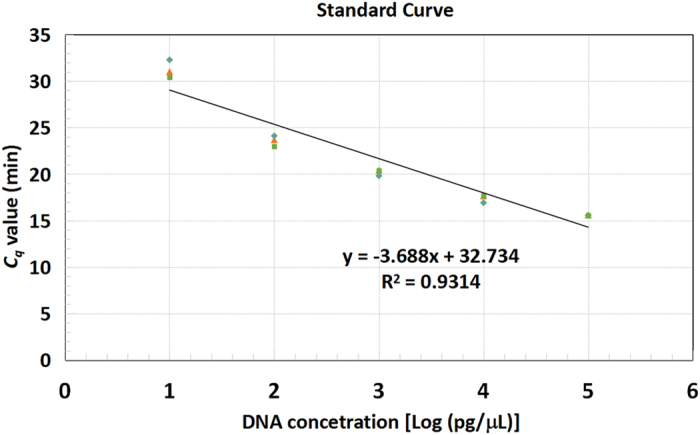
DNA templates with concentrations ranging from 100 ng/μL to 10 pg/μL were tested in triplicate. The standard curve shows DNA concentrations in log scale on the X -axis and Cq values (min) on the Y -axis.