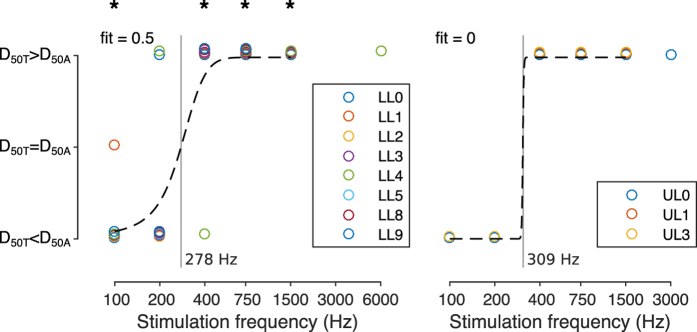
Figure 4. Comparison of 50% detection level for tactile (D50T) and auditory (D50A) sensations.
Tactile sensations were elicited by lower amplitude stimuli at 100 Hz and 200 Hz (D50T < D50A) in both groups. On the contrary, lower amplitude stimuli elicited auditory sensations at 400 Hz and higher frequencies (D50T > D50A). *indicates p < 0.05 for a specific stimulation frequency.

