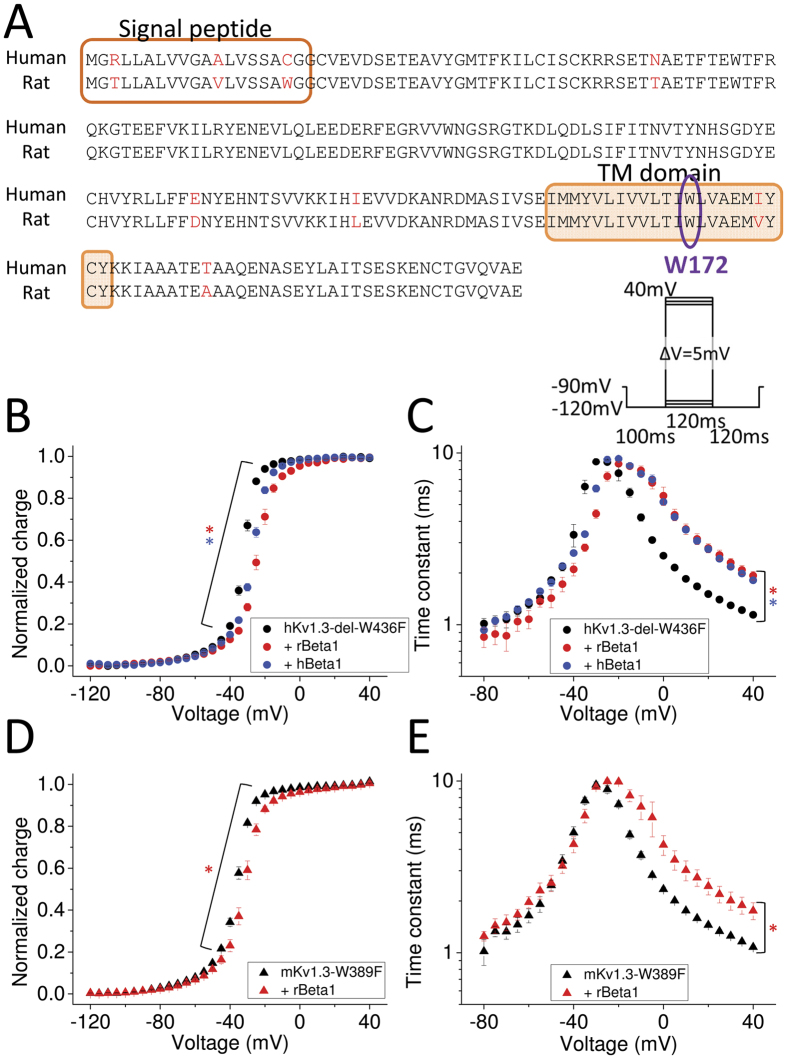
Figure 2. NavBeta effect on Kv1.3 gating currents in rodents and human.
(A) Amino acid sequence alignment of human NavBeta1 (hNavBeta1) and rat NavBeta1 (rNavBeta1). Residues that differ between them are highlighted in red. Transmembrane segment is indicated with an orange rectangle. W172 is indicated in purple circle (See also Fig. 5). (B,C) Q-V relationship (B) and time constants of on-gating currents as a function of voltage (Tau-V) (C) for hKv1.3-del-W436F alone (black circles, n = 8), and co-injected with rNavBeta1 (red circles, n = 5) or with hNavBeta1 (blue circles, n = 5). Red stars (*) indicate statistical significance (p-value < 0.05) of the difference between hKv1.3-del-W436F alone (black circles) and with rNavBeta1 (red circles) at voltages ranging from −50 mV to +10 mV in Q-V (B), and at voltages ranging from −15 mV to +40 mV for Tau-V (C). Blue stars (*) indicate statistical significance (p-value < 0.05) between hKv1.3-del-W436F alone (black circles) and with hNavBeta1 (blue circles) at voltages ranging from −45 mV to −10 mV for Q-V (B), and at voltages ranging from −15 mV to +40 mV for Tau-V (C). (D,E) Q-V relationship (D) and Tau-V (E) for mouse Kv1.3 (mKv1.3)-W389F alone (black triangles, n = 4) and co-injected with rNavBeta1 (red triangles, n = 4). Red stars (*) indicate statistical significance (p-value < 0.05) of the difference between mKv1.3-W389F alone (black) and with rNavBeta1 (red) for voltages ranging from −55 mV to −10 mV in Q-V (D), and at voltages ranging from 0 mV to +40 mV in Tau-V (E). The pulse protocol for gating current measurements is depicted in the upper right corner in C). Error bars indicate SEM.

