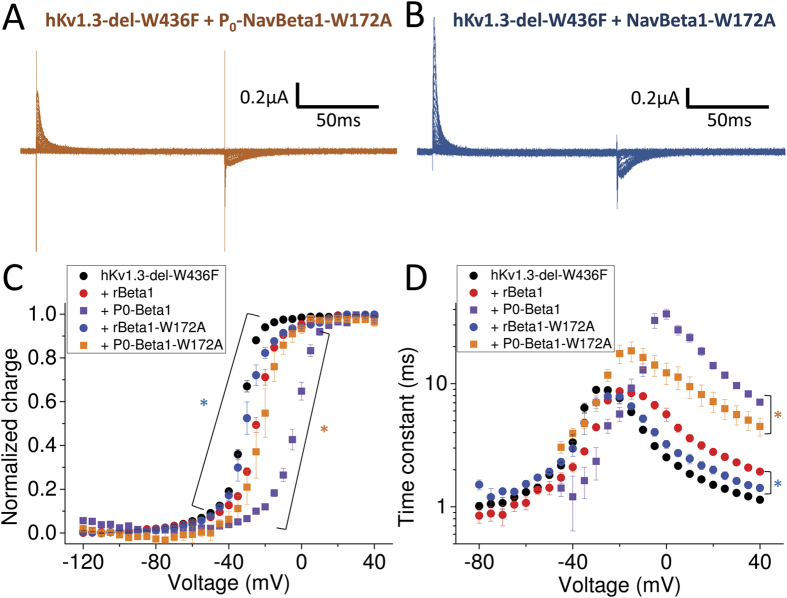
Figure 5. W172 in NavBeta1 transmembrane segment is part of an interaction interface with hKv1.3.
(A,B) Representative gating currents from hKv1.3-del-W436F co-injected with P0-NavBeta1-W172A (A) or with NavBeta1-W172A (B). (C,D) The Q-V relationship (C) and Tau-V curve (D) for hKv1.3-del-W436F alone (black circles, n = 8), co-injected with rNavBeta1 (red circles, n = 5), co-injected with P0-NavBeta1 (purple squares, n = 5), co-injected with P0-NavBeta1-W172A (orange squares, n = 3) or co-injected with NavBeta1-W172A (blue circles, n = 3). Error bars indicate SEM. Orange stars (*) indicate statistical significance (p-value < 0.05) of the difference between hKv1.3-del-W436F with P0-NavBeta1 (purple squares) and with P0-NavBeta1-W172A (orange squares) from −30 mV to +5 mV in Q-V (C), and from −40 mV to +40 mV except at −10 mV in Tau-V (D). Blue stars (*) indicate statistical significance (p-value < 0.05) of the difference between hKv1.3-del-W436F with rNavBeta1 (red circles) and with NavBeta1-W172A (blue circles) from −45 mV to −25 mV except at −40 mV in Q-V (C), and from −15 mV to +40 mV in Tau-V (D).

