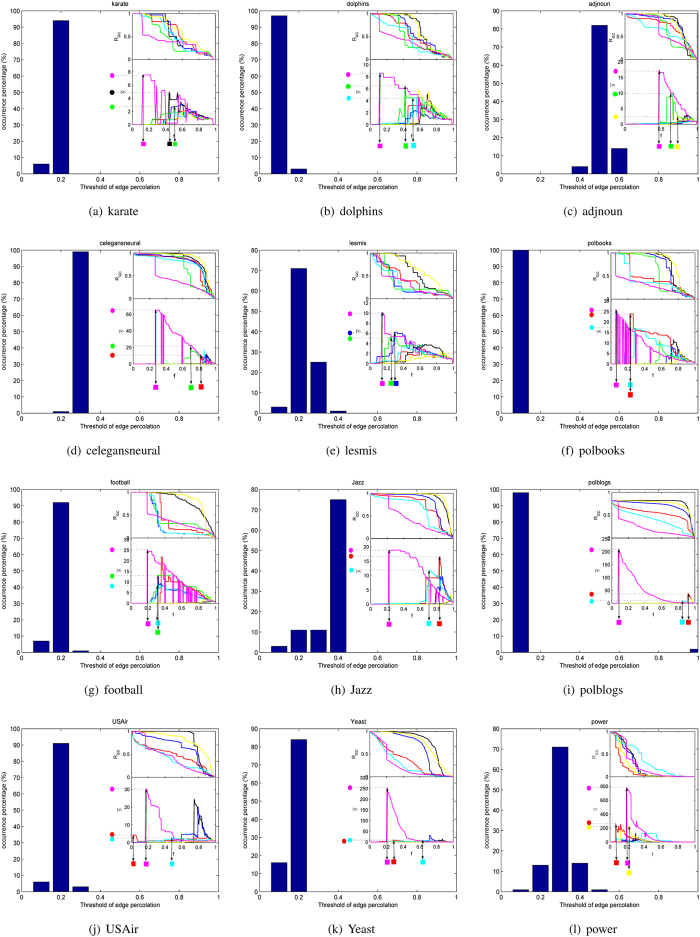
Figure 6. Distribution of thresholds of edge percolation with 100 random initial values of X in the LE on twelve real networks.
Each value of bar is the percentage of occurrences corresponding to different thresholds of edge percolation of the LE. Since the edge percolation thresholds of the LE in Fig. 4 are just one random occasion compared with Fig. 6, each sub-figure in Fig. 4 is added as a bin to its corresponding sub-figure of Fig. 6. Moreover, for better observation, the locations of edge percolation thresholds and peaks of the top three measurements with relative small thresholds in added bins are marked.

