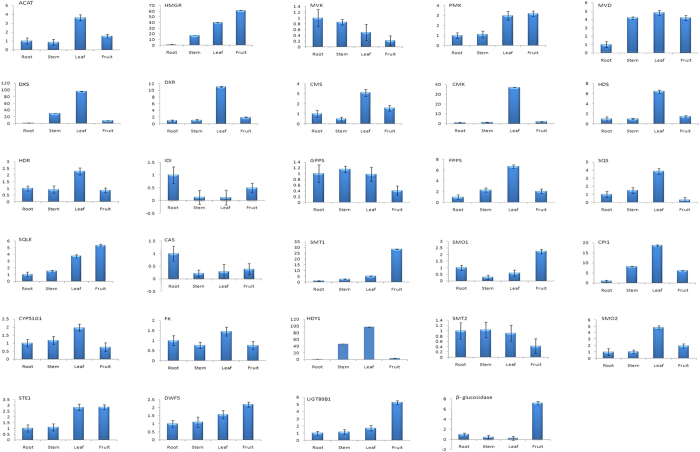
Figure 7. Expression pattern of steroidal saponin biosynthesis pathway genes in different tissues.
qRT-PCR analysis was performed using elongation factor 1 alpha (EF1α) as reference gene for normalization. X-axis represents tissues and Y-axis is the relative fold change in gene expression by considering rhizome as control tissue.

