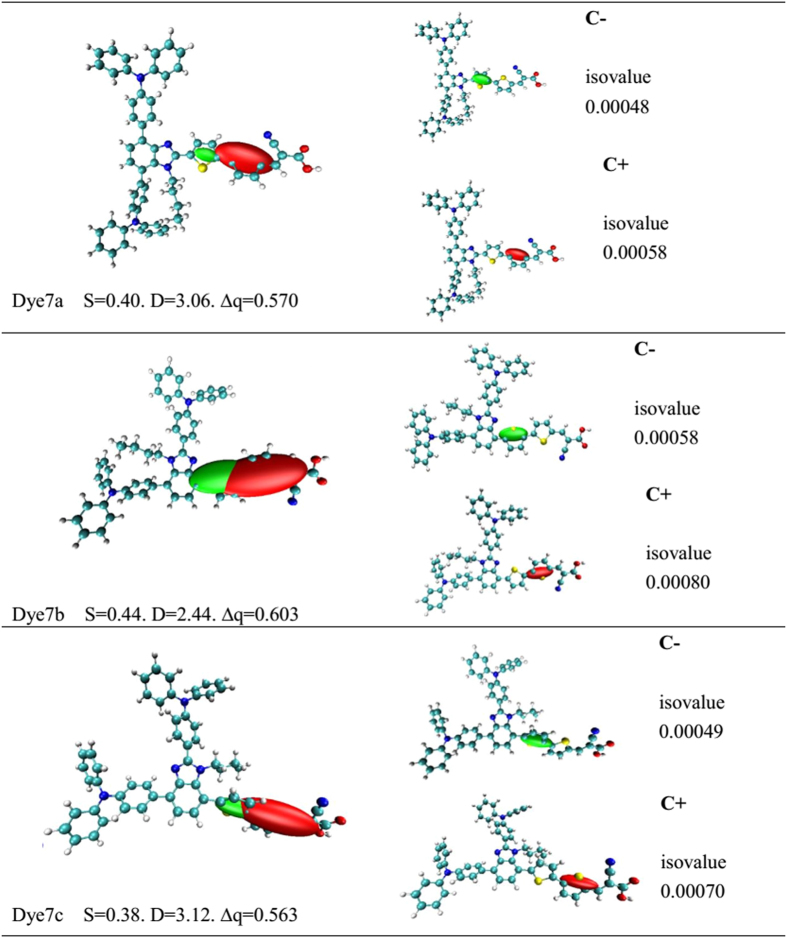
Figure 5. Graphical ellipsoid representations of CT which associated centroids of hole and electron (C+/C−)a; (aComputed difference in total density from S0 to S1 for all the dyes (isovalue 0.000493 a.u.), performed in THF solvent using CAM-B3LYP functional together with 6–31 G(d) basis set.
D is the electron transfer distance (Å), S is overlaps between the regions of density depletion and increment, ∆q is the fraction of electron exchange (|e-|)).

