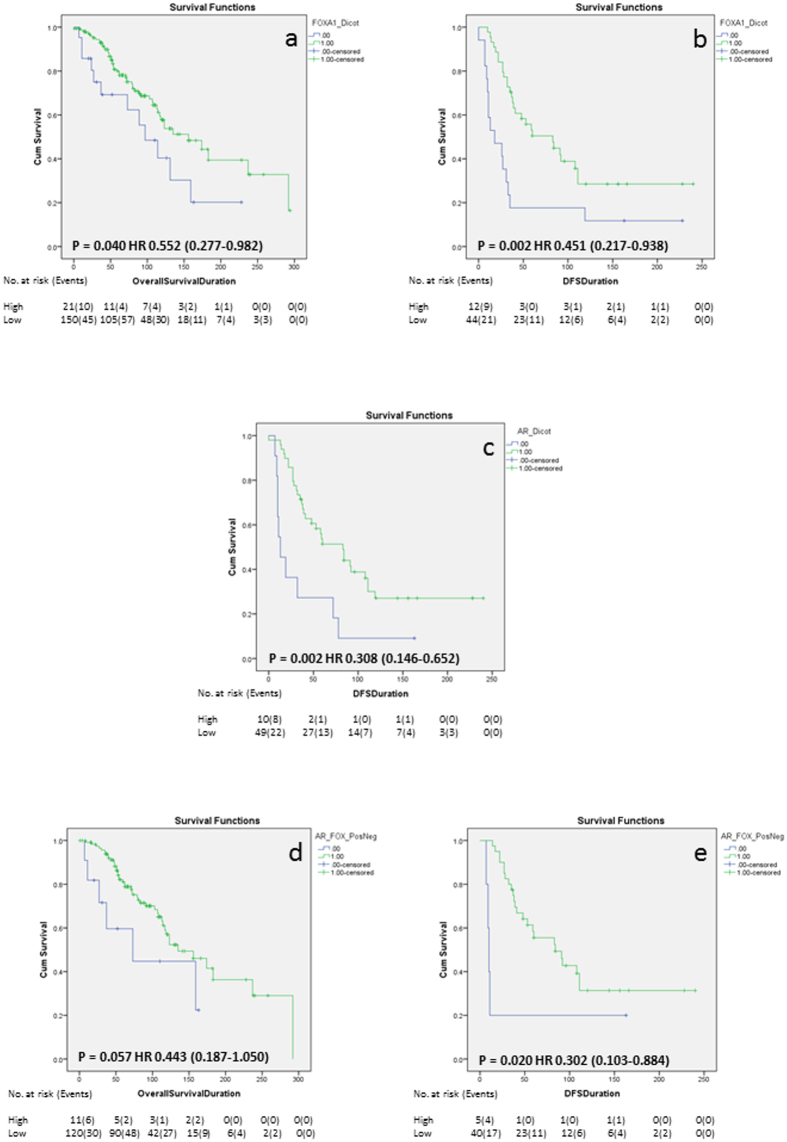
Figure 1. Kaplan-Meier survival analysis.
Kaplan-Meier survival analysis showing the impact of FOXA1 expression on OS (a) and DFS (b), the effect of AR expression on DFS (c) and the impact of AR and FOXA1 co-expression on OS (d) and DFS (e). The number of at risk patients and events over time are displayed under each graph.

