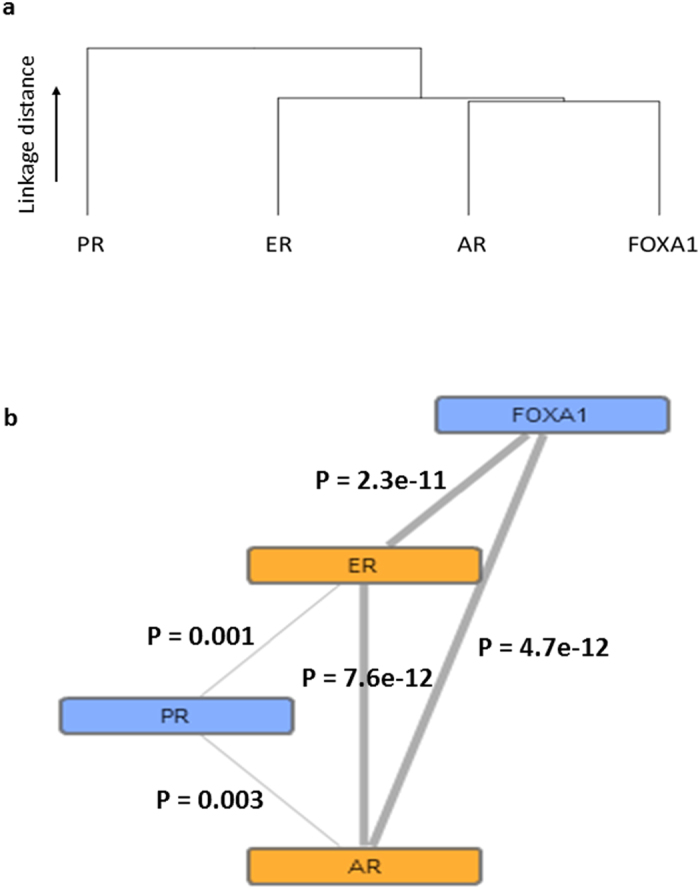
Figure 2. Correlative biomarker relationships.

Dendrogram showing biomarker correlations using agglomerative hierarchical clustering with complete linkage (a) with an example protein network (b) showing significant correlation relationships indicated by the thickness of line connections. Nodes range from blue to orange, indicating low to high degree of significance, respectively. P values are displayed on the image.
