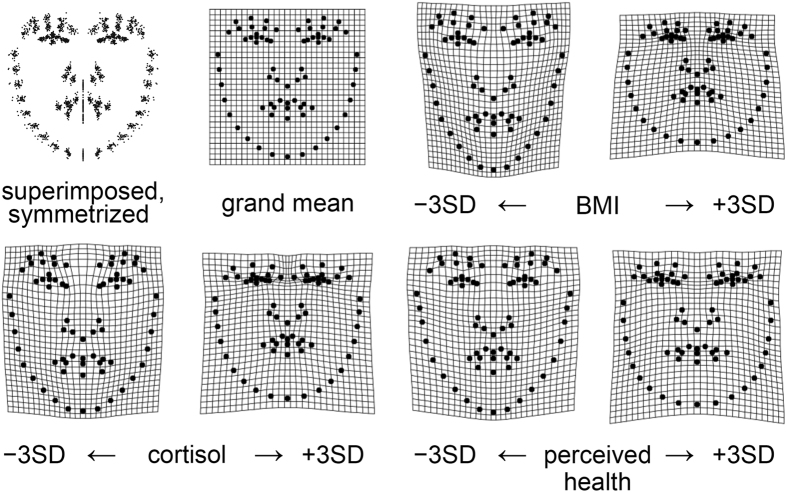
Figure 2. Visualization of symmetrized shape regressions upon BMI, cortisol and health rating by thin-plate spline (TPS) deformation grids.
The average landmark configuration corresponds to the undeformed grid. The complete symmetrized scatter of all shape coordinates that generate the grand mean is presented to its left. The deformations correspond to a decrease (left) or an increase (right) of 3 standard deviations of the predictor variable: BMI, top right pair; cortisol, bottom left pair; health rating, bottom right pair.

