
Figure 1.
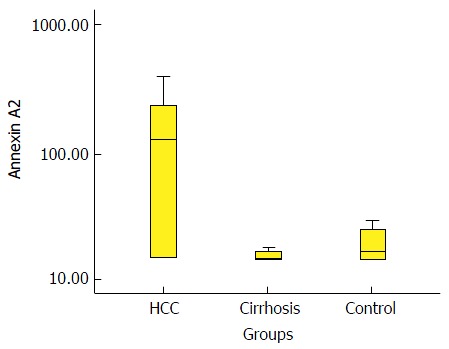
Box-plot diagram that shows the annexin A2 level in the three groups. HCC: Hepatocellular carcinoma.
Official websites use .gov
A
.gov website belongs to an official
government organization in the United States.
Secure .gov websites use HTTPS
A lock (
) or https:// means you've safely
connected to the .gov website. Share sensitive
information only on official, secure websites.
Box-plot diagram that shows the annexin A2 level in the three groups. HCC: Hepatocellular carcinoma.