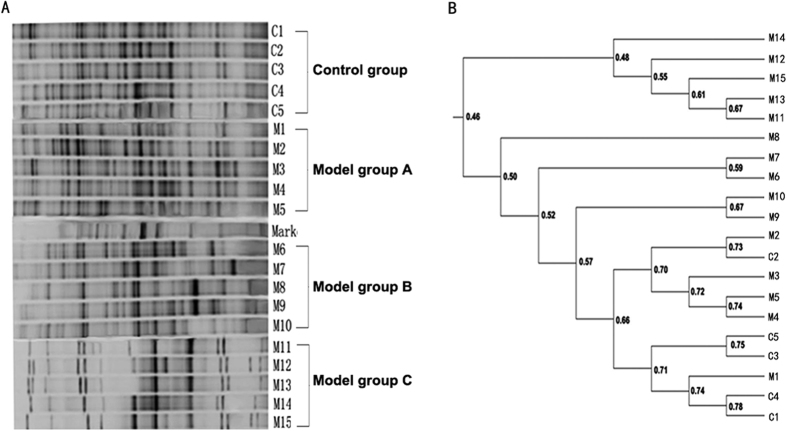
Figure 1. The variability of intestinal bacterial communities as determined by DGGE analysis of samples from the feces.
(A) Representative DGGE profiles of the fecal samples from control group and model group (A, B and C). C1 to C5 were representative of the control group, M1 to M5 were representative of the model group A, M6 to M10 were representative of the model group B, M11 to M15 were representative of the model group C. (B) Dendrogram generated from the bacterial community fingerprints of the feces, the similarities between mucosal specimens were shown in the dendrogram. Dice’s band-matching coefficient and unweighted pair group method with arithmetic averages (UPGMA) were employed to analyze the results.

