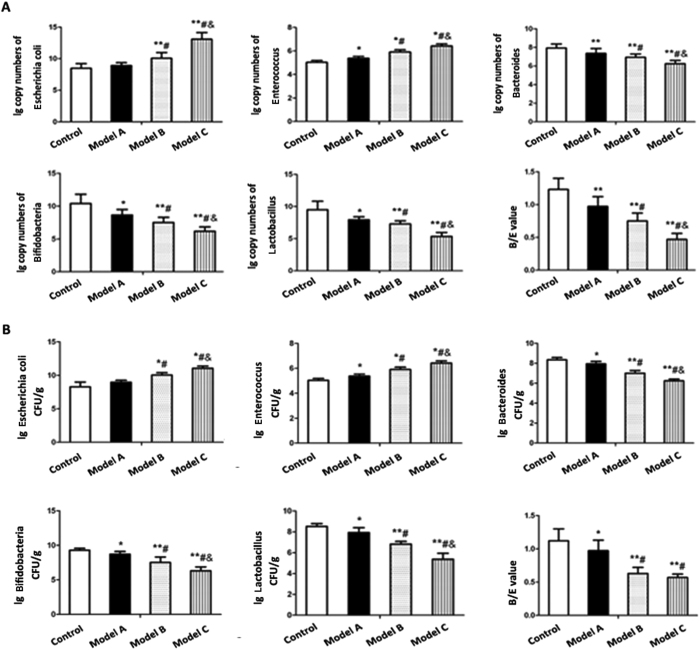
Figure 2. Comparison of five representative bacteria in feces of control group and model group A, B and C.
(A) Quantification of representative bacteria in feces by quantitative PCR analysis (B) Quantification of representative bacteria in feces by traditional culture method. The ratio of Bifidobacteria to Escherichia coli was used to indicate B/E value representing gut mircobiological colonization resistance. Data represent the mean ± SD of each group. *P < 0.05 compared to the control group; **P < 0.01 compared to the control group; #P < 0.05 compared to the model group A; &P < 0.05 compared to the model group B.

