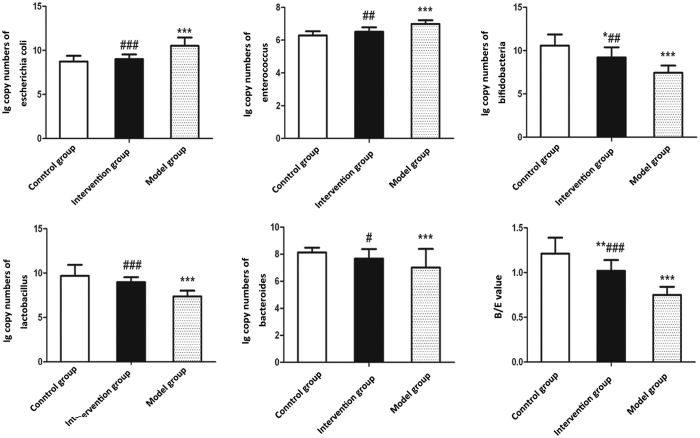
Figure 5. Effects of probiotics on gut microbiota dysbiosis in NAFLD models.
Quantitative PCR analysis of fecal five representative bacteria. Data represent the mean ± SD of each group. *P < 0.05 compared to the control group; **P < 0.01 compared to the control group; ***P < 0.001 compared to the control group; #P < 0.05 compared to the model group; ##P < 0.01 compared to the model group; ###P < 0.001 compared to the model group.

