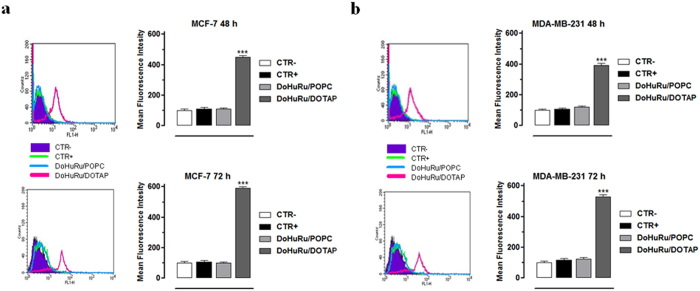
Figure 5. Autophagy activation in MCF-7 and MDA-MD-231 breast cancer cells.
Quantitative flow cytometric analysis of autophagosomes formation (MDC incorporation) in MCF-7 (a) and MDA-MD-231 (b) breast cancer cells, unlabeled and untreated (CTR−), labeled and untreated (CTR+), treated with IC50 concentrations of DoHuRu/POPC or with DoHuRu/DOTAP for 48 and 72 h, as indicated. The main fluorescence intensities (MFIs) were calculated, as described in ‘Materials and Methods’. In the corresponding bar graphs, values are expressed as percentage of control cells and are reported as mean of four independent experiments ± SEM (n = 24); ***p < 0.001 vs. control (untreated cells).

