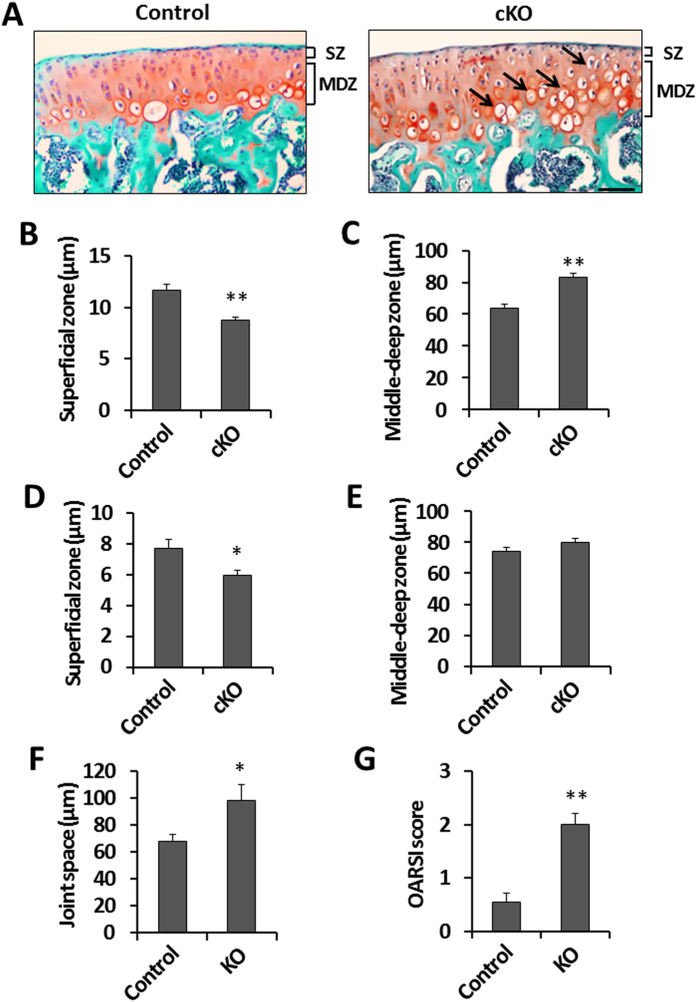
Figure 3. Histological changes in the articular cartilage of the Phd2 cKO mice.
(A) Safranin-O staining of 4 week old control and cKO tibiae. Arrows show hypertrophic chondrocytes. (B) SZ thickness in control and cKO tibiae at 4 weeks of age. (C) MDZ thickness in control and cKO tibiae from 4 week old mice. (D) SZ thickness in 12 week old control and cKO tibiae. (E) MDZ thickness in 12 week old control and cKO tibiae. (F) Thickness of joint space in 12 week old control and cKO tibiae. (G) OARSI score in 12 week old control and cKO tibiae. *P < 0.05, **P < 0.01, n = 8/group in (B,C), n = 6/group in (D–G). Data were presented as the mean ± SEM. Bar = 50 μm.

