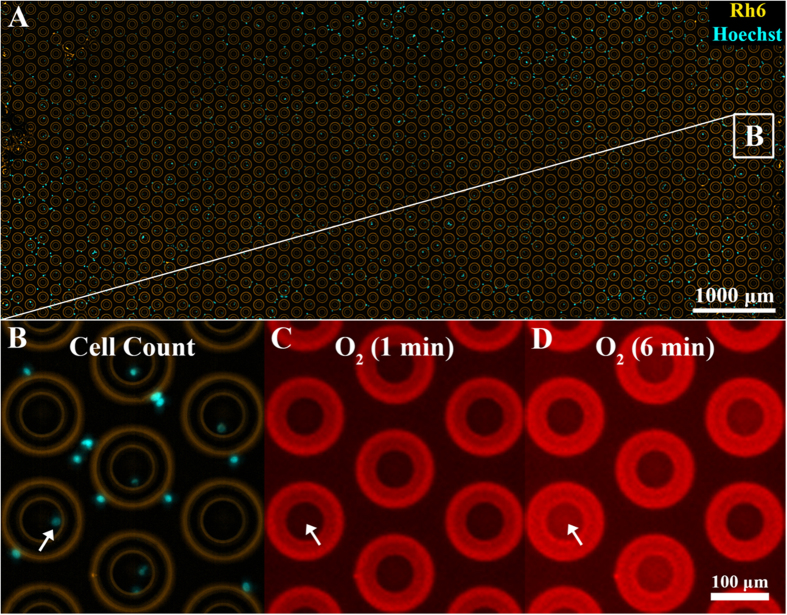
Figure 2. The Cellarium data collection.
(A) Overlay of micrographs taken in the rhodamine (Rh6) and Hoechst spectral channels of an array of 1,033 microwells (yellow) after random seeding of cells stained with the Hoechst 33342 nuclear DNA marker (blue); (B) Zoom-in of the area indicated in (A). The light blue spots represent the stained cell nuclei. Cell seeding conditions were optimized to maximize single cell occupancy of the wells (arrow); (C) Micrograph of the same area as in (B) taken in the oxygen sensor channel at the beginning of an assay. The outside and inside of the wells show the same sensor intensity; (D) The same region of the array as in (C) at 6 minutes after assay start. As a result of cellular respiration, the emission intensity of the oxygen sensor inside, but not outside, of the sealed wells increases. The respiration rate is determined by calculating the slope of the sensor intensity response as a function of time.

