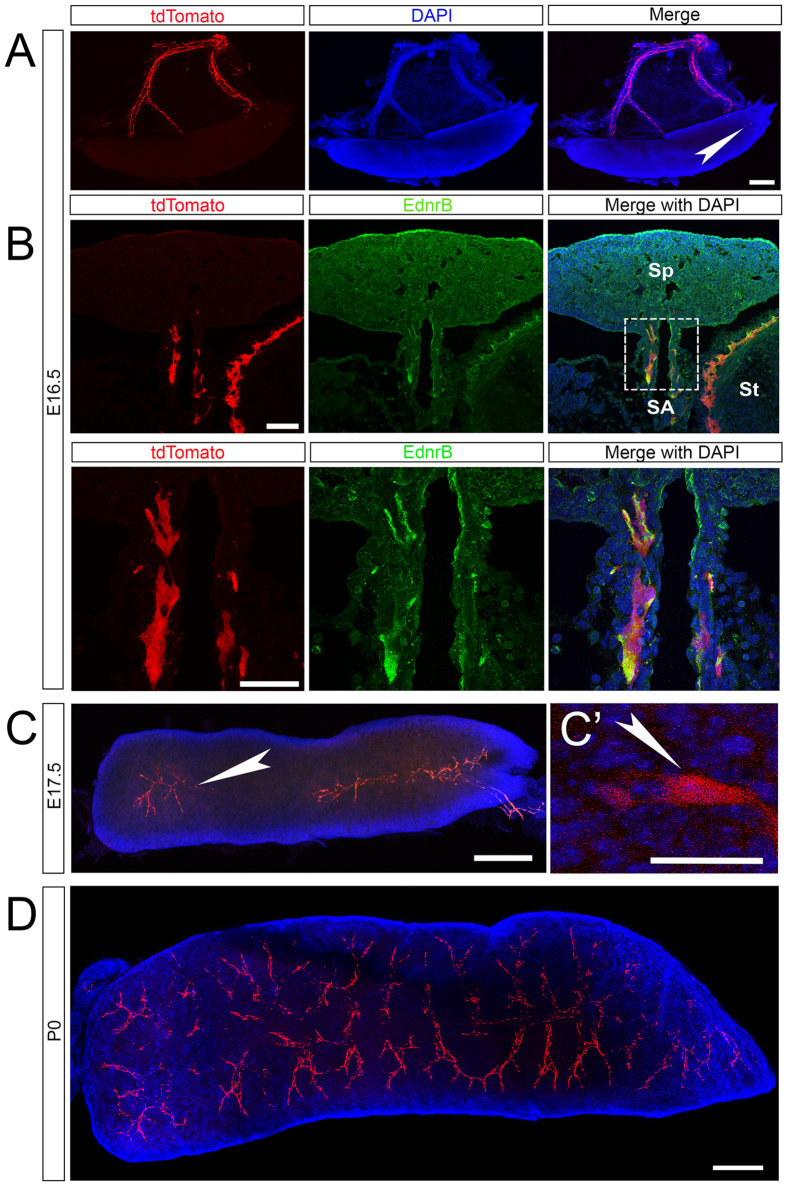
Figure 2. Identification of entry of tdTomato expressing NCC into the spleen.
(A) Whole mount preparation of the spleen and hilar structures at E16.5 shows numerous NCC on the hilum and a small number within the spleen. (B) Upper panel: 16 μm section showing tdTomato NCC entering the spleen (Sp) along the hilum (splenic artery SA, stomach St) express EdnrB (yellow in merged panels). Lower Panel: High magnification of boxed region in upper panel. (C) At E17.5, tdTomato NCC enter the spleen from the hilum and colonize the organ. (C’) High magnification view of a single splenic NCC at E17.5. (D) By P0, large numbers of NCC have colonized the spleen in an arborized pattern. Arrowheads (white) highlight individual splenic NCC. Scale bars: A 200 μm, B 50 μm, C 200 μm, C’ 20 μm, D 200 μm.

