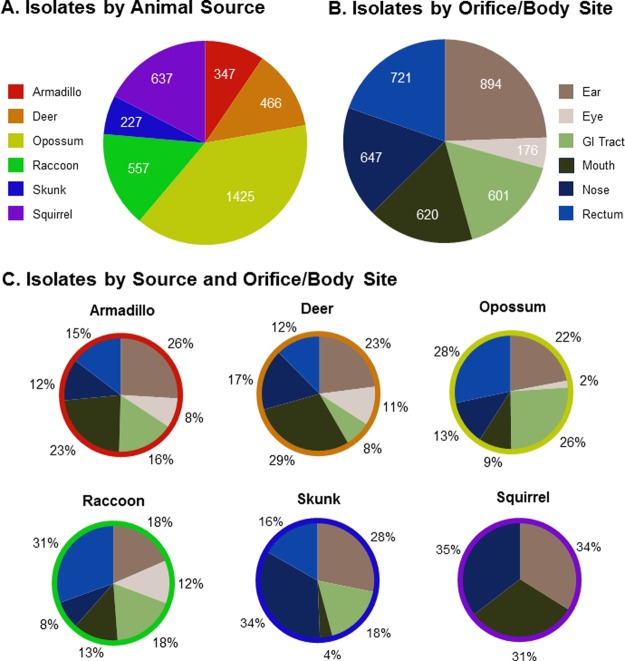
Figure 2.
Summary of the bacterial isolates collected from roadkill mammals. (A) Breakdown of the 3659 roadkill microbiome isolates based on the source organisms from which they were derived. (B) Distribution of the isolates based on the locations/orifices on the carcasses from which they were derived. (C) Categorization of the isolate data illustrating the percent contribution of each body site to the overall bacterial collection prepared from the different animal species (note that the colors and categories used to construct the slices within each of the pie charts in panel C are the same as those used for the pie chart in panel B).

