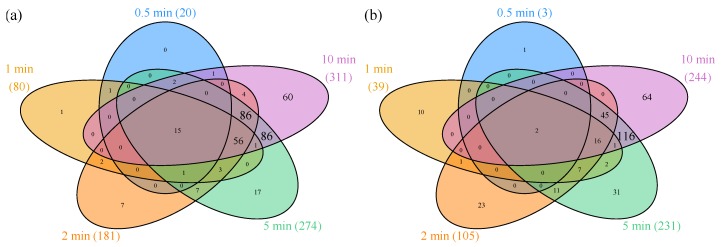
Figure 1.
Venn diagrams of differentially expressed (DE) genes. Number of genes with increasing (a) and decreasing (b) expression compared to anaerobic control at the specified time points (total number of DE genes at the specified time points are provided in brackets). The numbers in overlapping regions represent DE genes at the corresponding time points. Areas are not drawn to scale. Genes are considered DE compared to anaerobic steady state, if |fold change (FC)| > 2 and false discovery rate (FDR) corrected p value < 0.05.

