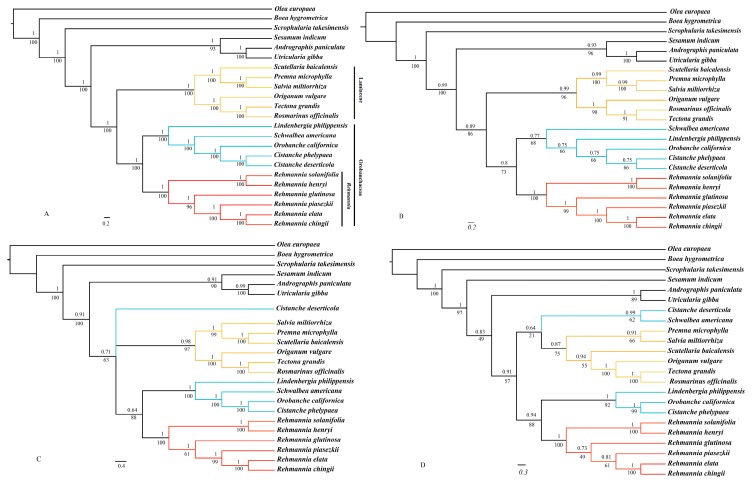
Figure 6.
Phylogenetic trees of 23 species as determined from different data partitions. Support values are shown for nodes as Bayesian inference posterior probability (above branches)/maximum likelihood bootstrap (below branches). Branch lengths were calculated through Bayesian analysis, and scale bar denotes substitutions per site. (A) the whole chloroplast genomes; (B) Protein coding genes; (C) LSC region; (D) SSC region. Red represents Rehmannia species; Blue represents other species of Orobanchaceae; Orange represents Lamiaceae species.

