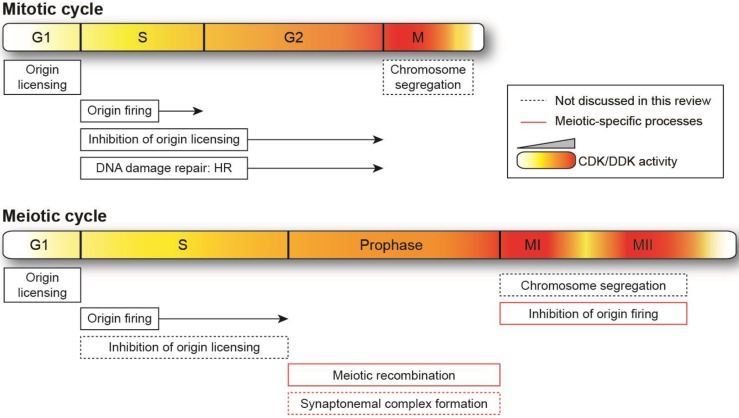
Figure 1.
Schematic representation of mitotic and meiotic cycles. Relative changes in cyclin-dependent kinase (CDK) and Dbf4-dependent kinase (DDK) activity are illustrated by the intensity of the gradient (yellow-red), with more intense red denoting higher levels. For ease of visualization, the higher activities required in meiosis vs. mitosis are not depicted. The lengths of the cell cycle phases are not shown to scale. HR: homologous recombination. Meiosis-specific events are highlighted in red boxes, and processes that are not discussed in this review are indicated by dotted lines.

