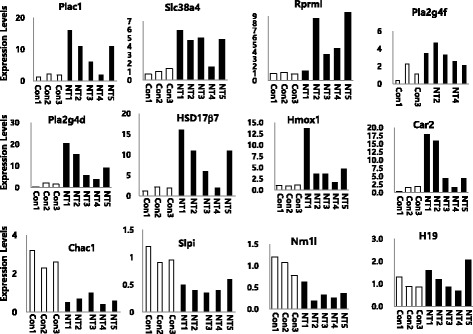
Fig. 2.

Quantitative real time PCR analysis. Twelve genes from different categories were chosen for qRT-PCR analyses. Eight genes were upregulated in the SCNT placentas. The other three genes were upregulated in the control group. H19 showed almost the same expression pattern. The β-actin gene was used as the endogenous control
