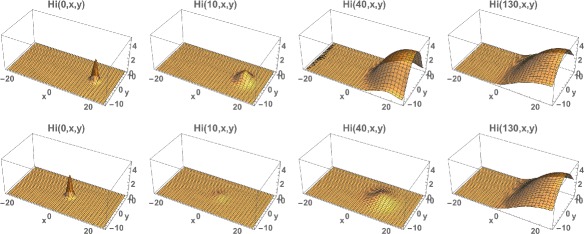
Fig. 13.

Example 5. Top: Model simulation of the spatial distributions of infected cases at time=0, 10, 40, 130, with the initial data located in the eastern region. Bottom: Model simulation of the spatial distributions of infected cases at time=0, 20, 40, 130, with the initial data located in the western region. Both simulations converge to the same limiting density, but the one with the initial data in the western region first decreases before increasing and converging
