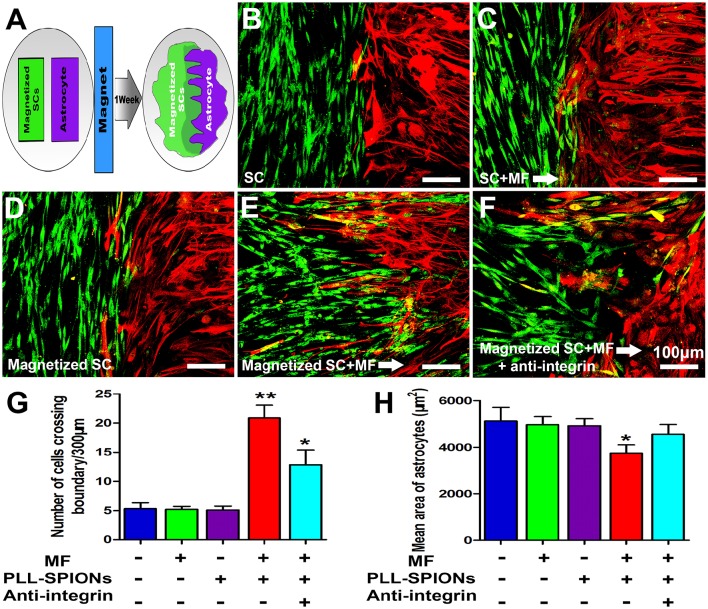
Figure 7.
SC-astrocyte confrontation assay. (A) A schematic drawing showing that magnetized SCs and astrocytes were seeded in parallel strips and were allowed to migrate and intermingle for 1 week under an applied MF. (B–F) Representative images of the SC-astrocyte confrontation assay. (G) Quantification of the confrontation assay. SCs were immunolabeled for P75 (green) while astrocytes were immunolabeled for GFAP (red). (H) Quantification of mean area of astrocytes in contact with SCs. Arrows point in the direction of the MF. Scale bar = 100 μm. Data are expressed as means ± SD; **p < 0.01,*p < 0.05.

