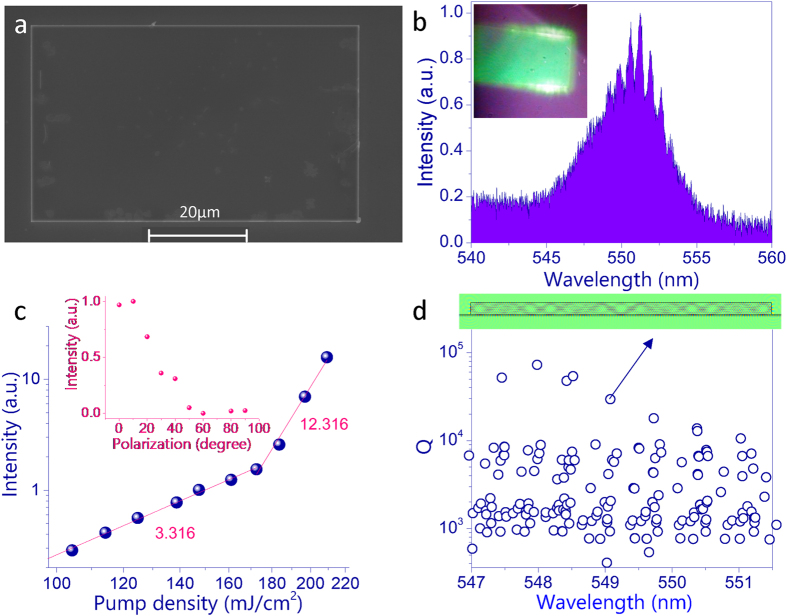
Figure 3.
(a) Top view SEM image of a rectangle CH3NH3PbBr3 microplate. (b) The emission spectrum of the microplate with the pumping density at 197 mJ/cm2. The inset is the corresponding fluorescent microscope image. (c) The integrated output intensity as a function of pumping density. Inset shows the polarization of emitted laser in (b). (d) The numerical calculated cavity Q factors within the lasing wavelength range. The inset is the field pattern (Ez) of mode-1.

