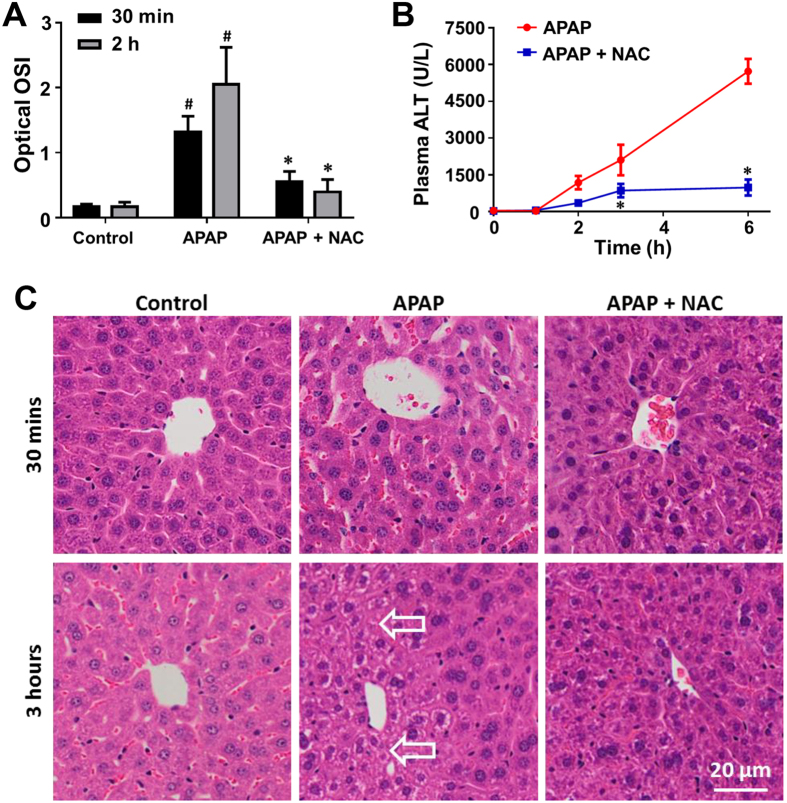
Figure 5. Optical oxidative stress index (OSI) of the liver detects response to NAC treatment against APAP induced liver injury.
(A) Optical OSI of the liver at 30 min and 2 hours after NAC treatment (75 and 165 min after APAP administration). (B) Concentration-time profile of ALT levels in peripheral blood of the APAP and APAP + NAC groups. (C) Representative histology (H&E staining) of the liver of the control, APAP, APAP + NAC groups at 30 min and 3 hours after NAC treatment (75 and 225 min after APAP administration). Arrows indicate cellular necrosis. Values are the mean ± s.d. for n = 5 mice; *p < 0.05, compared with untreated groups; #p < 0.05, compared with control group.

